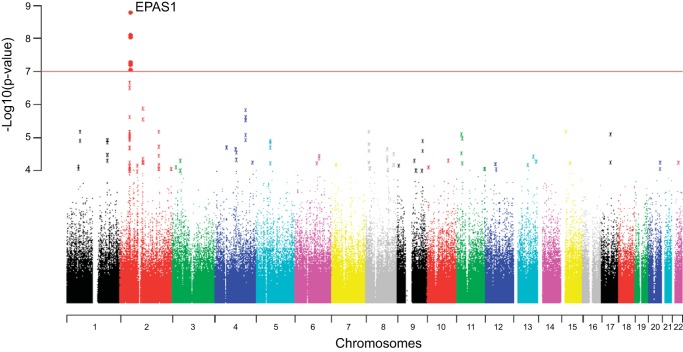
Fig. 6.
A genome-wide scan of allelic differentiation between population samples of Tibetans (resident at 3,200-3,500 m in Yunnan Province, China) and Han Chinese. The vertical axis of the graph shows the negative log of site-specific P values for allele frequency differences between the Tibetan and Han Chinese population samples (low P values denote allele frequency differences that are too large to explain by genetic drift). The horizontal axis of the graph shows the genomic positions of each assayed nucleotide site, arranged by chromosome number. The red line indicates the threshold for genome-wide statistical significance (P = 5 × 10⁻⁷). Values are shown after correction for background population stratification using an intragenomic control. Several noncoding variants flanking the EPAS1 gene are highly significant outliers. [Reprinted from (18) with permission: Natural selection on EPAS1 (HIF2α) associated with low hemoglobin concentration in Tibetan highlanders. Beall CM, et al., Proc Natl Acad Sci USA 107: 11,459-11,464, 2010].

