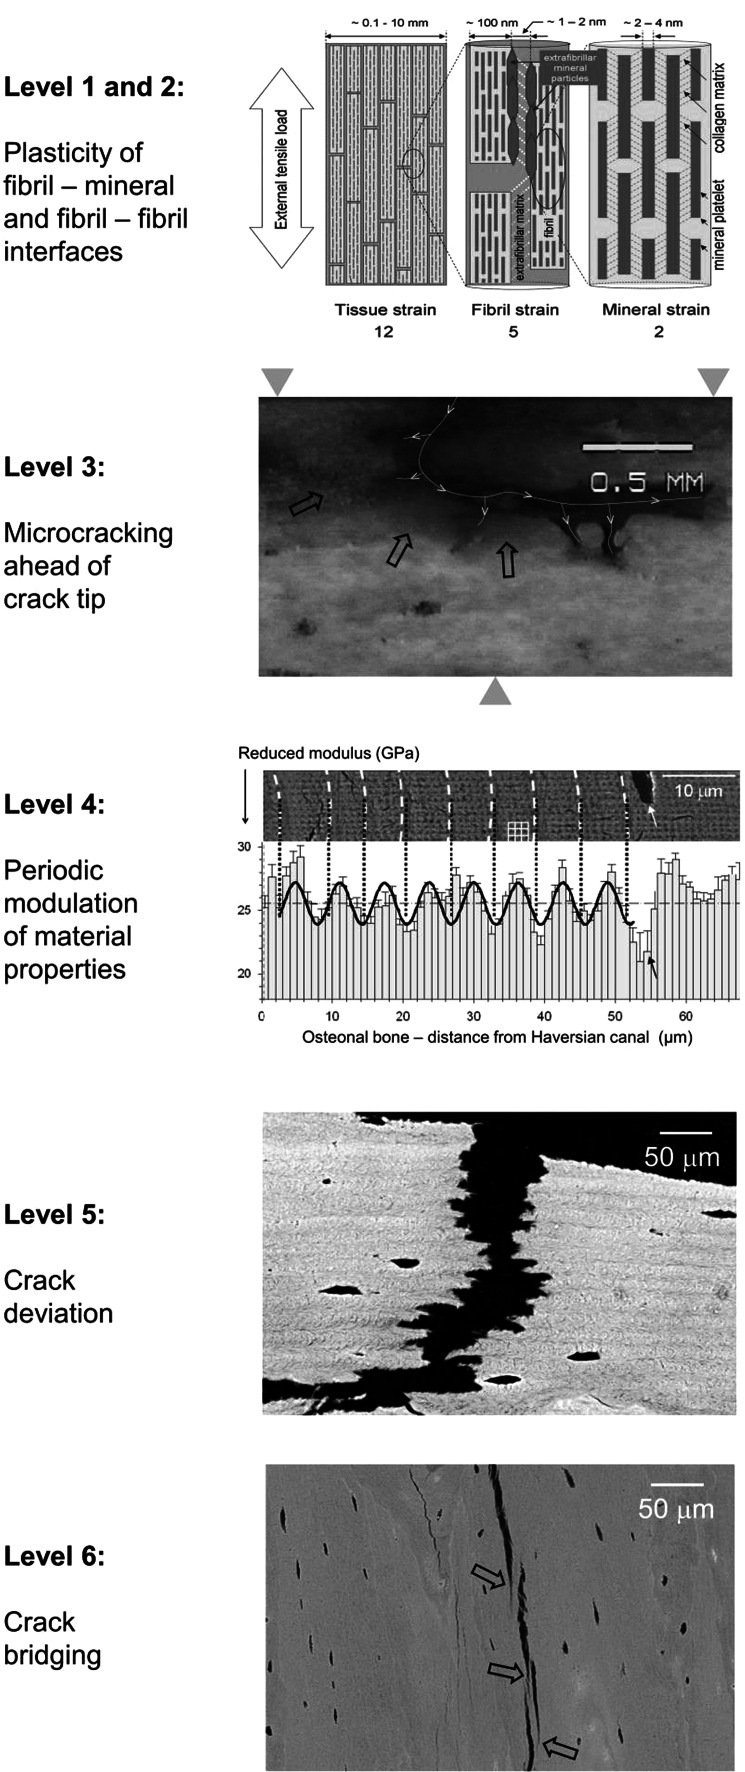
Fig. 4.
Six well-documented toughening mechanisms operating at different scales [6, 55]. Levels 1 and 2 show the potential of shear deformation between mineral and collagen (few nanometer scale) and between collagen fibrils (100-nm scale). The numbers under the graph indicate the relative magnitude of the stains at the different levels (12:5:2). Level 3 shows penetration of rhodamine stain (black arrows) into compartments well ahead of the crack tip, most likely because of the formation of micro-cracks. The yellow line indicates the crack that is deviating and splitting. Level 4 shows the periodic modulation of the indentation modulus within successive lamellae in the osteon. Level 5 shows crack undulating deviation across lamellar bone. Level 6 shows crack bridging by uncracked ligaments (black arrows). Pictures are adapted from [57] for level 1/2, from [55, 58] for levels 3, 5 and 6 (with permission from Macmillan Publishers, Ltd.), and from [59] for level 4 (with permission from Cambridge University Press)

