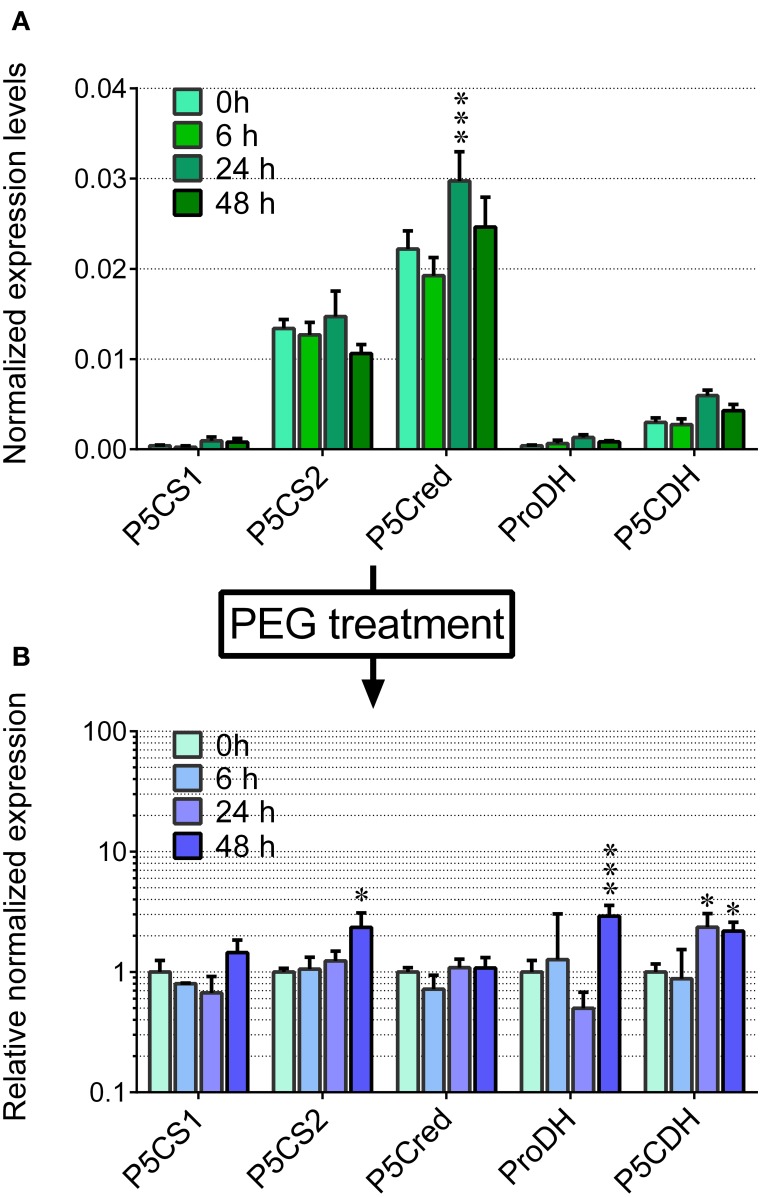
Figure 3.
Transcript levels of the genes involved in proline synthesis from glutamate and its re-oxidation in PEG-treated rice cells. The expression levels were quantified in suspension cultured cells of rice (cv Vialone nano) by real-time PCR following reverse transcription. Levels were normalized with respect to Actin 1 (Os03t0718100-01) cDNA (A). The same experiment was performed with cells treated with 22.5% PEG 6000, harvested at increasing time after the treatment. Expression levels were in this case normalized with respect to those in untreated controls (B). All treatments were carried out in triplicate, and means ± SE are reported. Results were subjected to analysis of variance, taking into account the Bonferroni correction for multiple testing; *, ***: significantly different at the 10% and 1% level, respectively, with respect to time 0 (A) or untreated controls (B).

