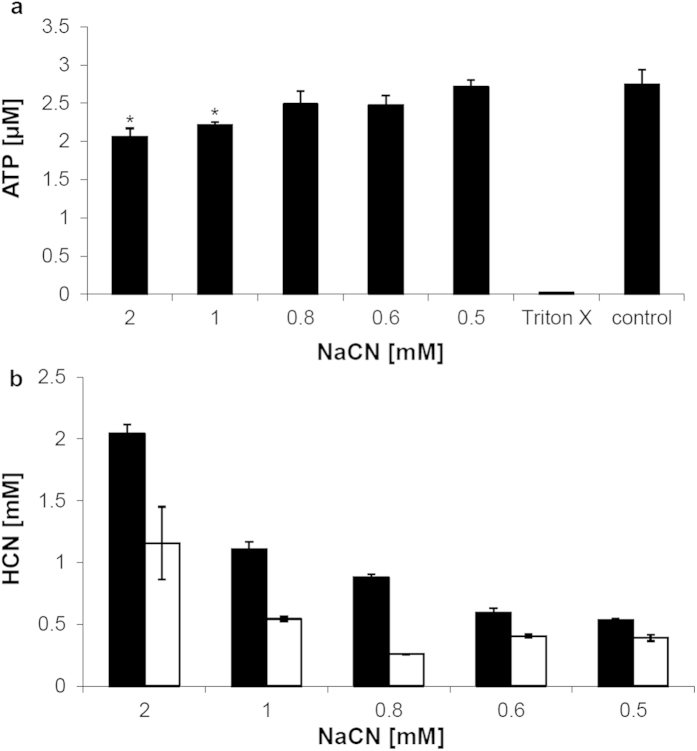
Figure 5. Toxicity of NaCN (respectively CN– ions) in HaCaT cells in vitro.
(a) ATP levels in cells treated with various doses of NaCN for 30 min in 96-well plates sealed with parafilm and compared to the control (that is, a 1:10 dilution of 5 × 10⁻⁶ N NaOH); Triton X was used as death control to verify depletion of ATP under toxic conditions. Values are displayed as mean ± SD (n = 4) for all groups except 0.6 mM NaCN (n = 3). Average ranks in control cells and cells treated with 1 mM and 2 mM NaCN were 6.5 and 2.5, respectively (Mann-Whitney U-Test, p = 0.029 two-tailed, *p < 0.05). Ranked, unequal variance t-test resulted in p = 0.005 and p = 0.013 for cells treated with 2 mM and 1 mM NaCN when compared to the controls, respectively. (b) HCN recovery from cell culture media before (black bars) and after 30 min of incubation at 37 °C (light bars). Prior to incubation, varying doses of NaCN were added to the media as indicated. Values are displayed as mean ± SD (n = 3).

