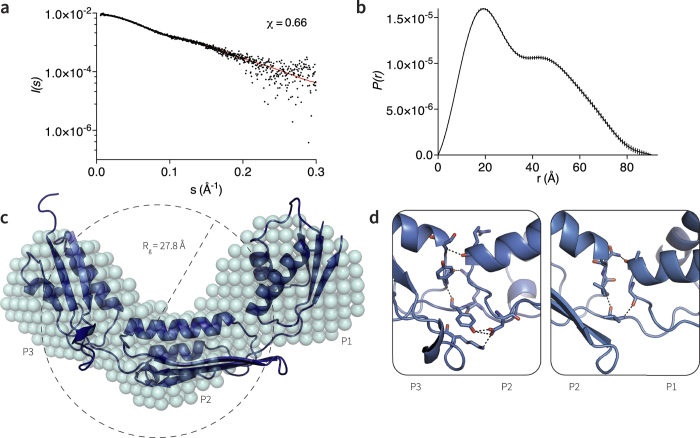
Figure 2. Solution small angle X-ray scattering structure of TamA POTRA1–3.
(a) Scattering data fitted (black dots) fitted against predicted theoretical scattering curve using CRYSOL (red line). Calculated parameters shown in Supplementary Table 3. (b) Comparison of the pair-wise distribution P(r) functions calculated from the experimental and theoretical profiles plotted against r in Å (error bars are indicated). (c) Model derived from ab initio reconstruction, calculated using DAMMIF39 and DAMAVER40, as shown by the teal spheres. Superimposed on this is the crystal structure (pdb 4C00). (d) Representation of the interfaces between TamA POTRA2 and POTRA3 (left), and TamA POTRA1 and POTRA2 (right), revealing polar interactions between the POTRA domains. Drawn as sticks are the main interacting residues between each POTRA domain; dashed lines represent hydrogen bonds.

