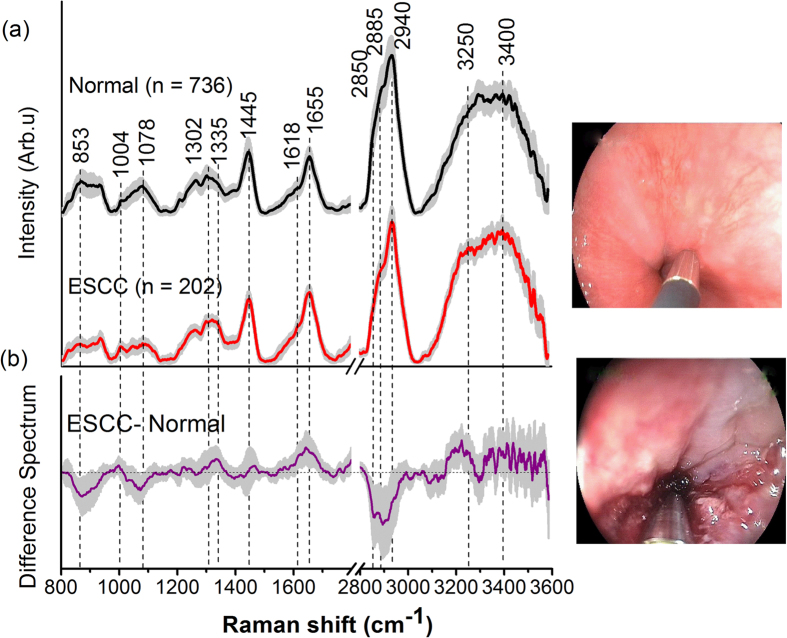
Figure 1.
(a) The mean in vivo FP/HW Raman spectra ± 1 standard deviation (SD) of the training dataset (80% of the total dataset) (normal (n = 736); ESCC (n = 202)) for diagnostic algorithms development; (b) Difference spectra (ESCC - normal) ± 1 SD resolving the unique spectral features of ESCC. The corresponding images of the WLR-guided FP/HW Raman procedures on normal esophagus and ESCC are also shown.

