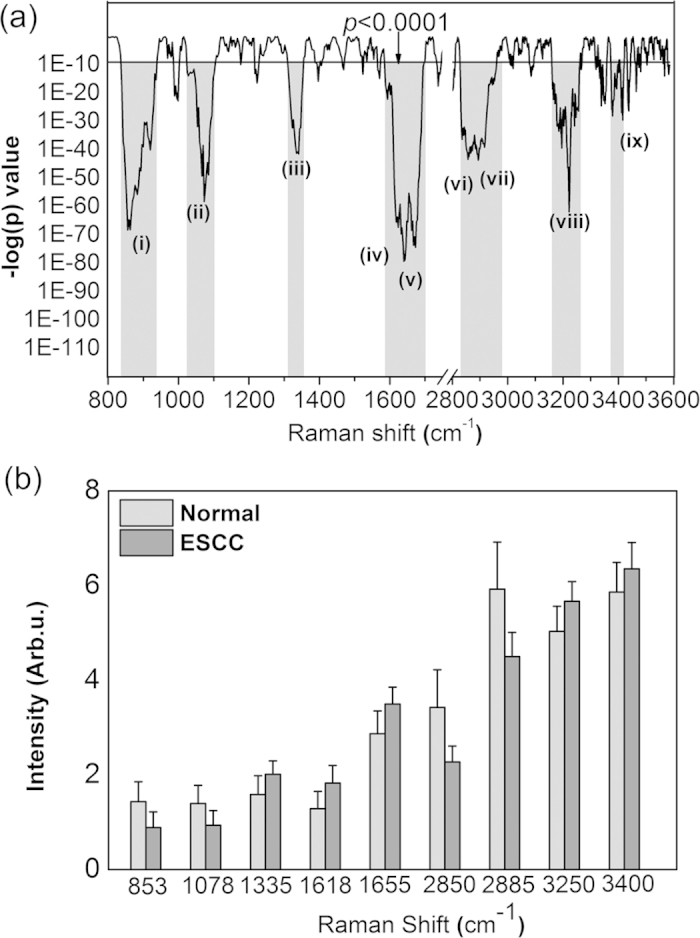
Figure 2.

(a) Unpaired two-sided Student’s t-test on Raman peak intensities of the training dataset (80% of the total dataset) (normal (n = 736); ESCC (n = 202)) over the entire spectral range (i.e., 800–1800 cm−1 and 2800–3600 cm−1). Seven Raman spectra sub-regions containing the diagnostically significant information were identified. (b) Histogram ± 1 SD of the most diagnostically significant Raman peaks (*p < 1E-10).
