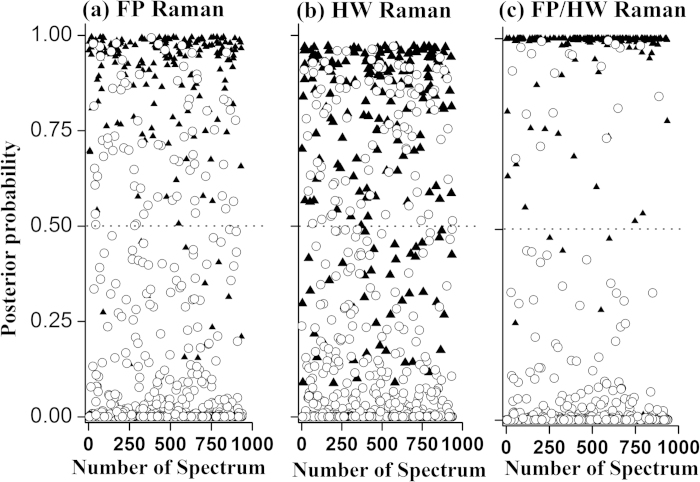
Figure 4.
The posterior probabilities of in vivo Raman spectra belonging to (i) normal esophagus (n = 736), and (ii) ESCC (n = 202) of the training dataset (80% of the total dataset), using partial lease square-discriminant analysis and leave-one-patient out cross validation based on the FP, HW and the integrated FP/HW Raman techniques, respectively. (◯) normal; (▲) ESCC.

