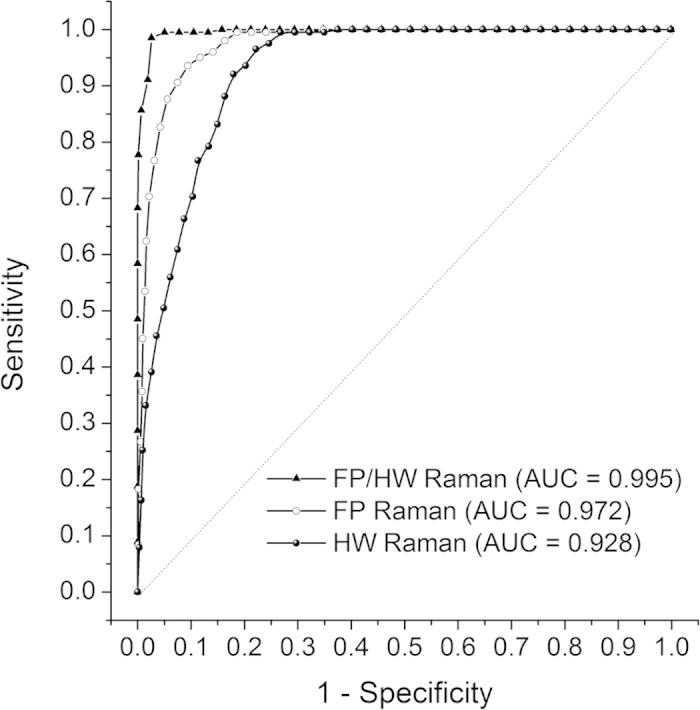
Figure 5. Receiver operating characteristic (ROC) curves for separating ESCC from normal esophageal tissue for the training dataset (80% of the total dataset).

The areas under the ROC curves (AUC) are 0.972, 0.928 and 0.995, respectively, using the FP, HW and the integrated FP/HW Raman techniques.
