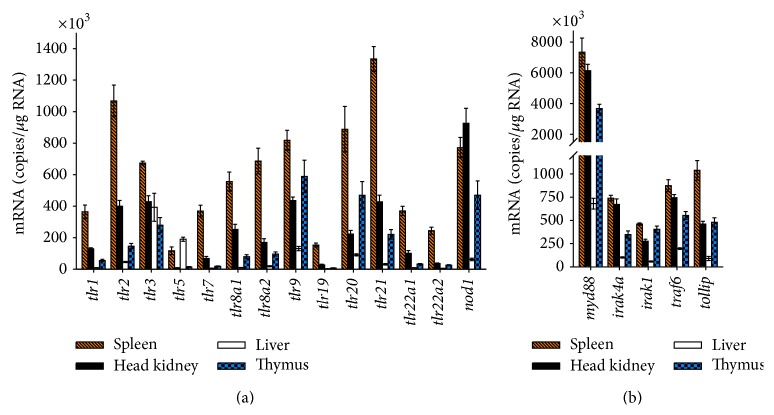
Figure 2.
Copy number of (a) PRRs and (b) downstream signaling factors in selected tissues from healthy trout. Quantitative RT-PCR was used to determine the number of transcripts/μg total RNA (ordinate) in spleen (dashed bars), head kidney (filled bars), liver (open bars), and thymus (chequered bars) of five healthy rainbow trout. Bars indicate mean ± SEM.

