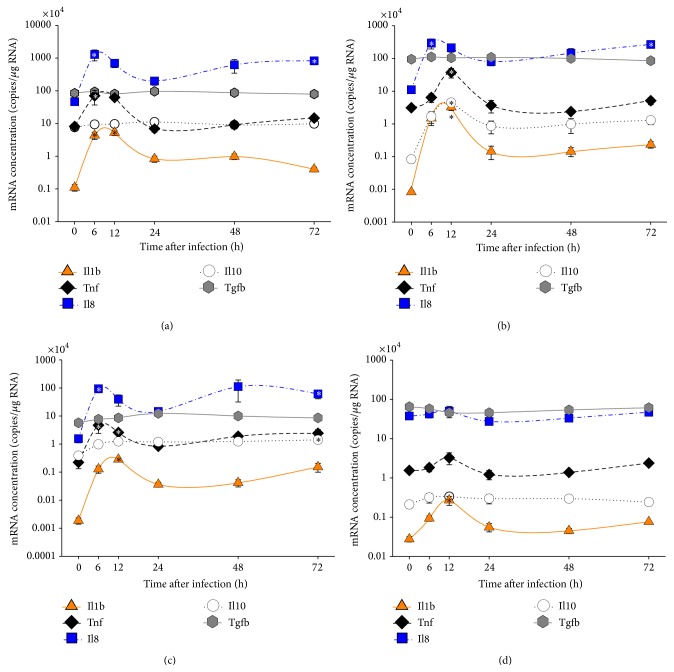
Figure 3.
Relative levels of mRNAs encoding cytokines in selected immune organs of trout after infection with A. salmonicida. The relative number of mRNA copies (ordinate) encoding Il1b (triangles; full line), Tnf (diamonds; broken line), Il8 (squares; line-dot-line), Il10 (circles; dotted line), and Tgfb (hexagon; full gray line) is plotted against the time after infection (abscissa). Different tissues (a) spleen, (b) head kidney, (c) liver, and (d) thymus were collected from five individuals/time point. Values are given as mean ± SEM; the pertinent data are listed in Table 2. Note that the relative quantity is presented on a log10 scale. Asterisks indicate significant differences with p < 0.05 compared to the control group (0 h).

