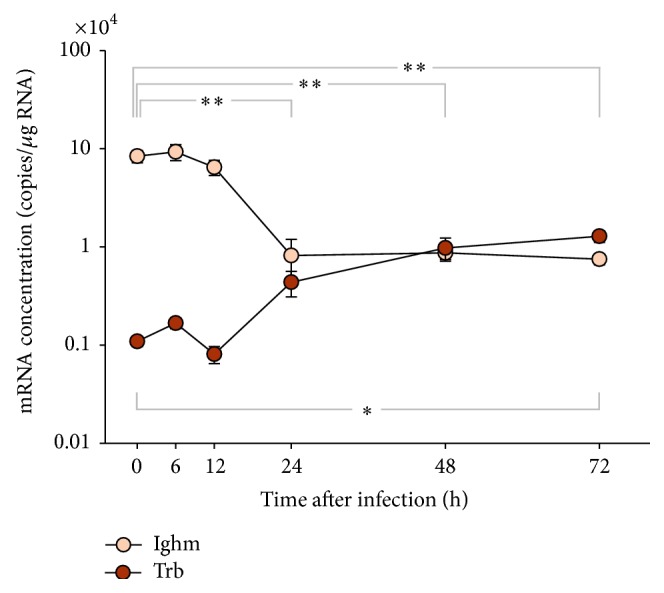
Figure 6.

Dynamics of T and B cell migration in head kidney after infection. Ordinate shows the relative number of mRNA copies (per μg total RNA) encoding the T cell receptor beta (TRB) and immunoglobulin M (Ighm) inhead kidney of five individuals/time point at various times after infection (abscissa). Values are given as mean ± SEM. Note that the relative quantity is presented on a log10 scale. Asterisks denote statistical significance with p < 0.01 (∗∗) and p < 0.05 (∗) compared to controls above (ighm) and below (trb) the graph. Statistical significance was assessed with a double sided t-test.
