Figure 1.
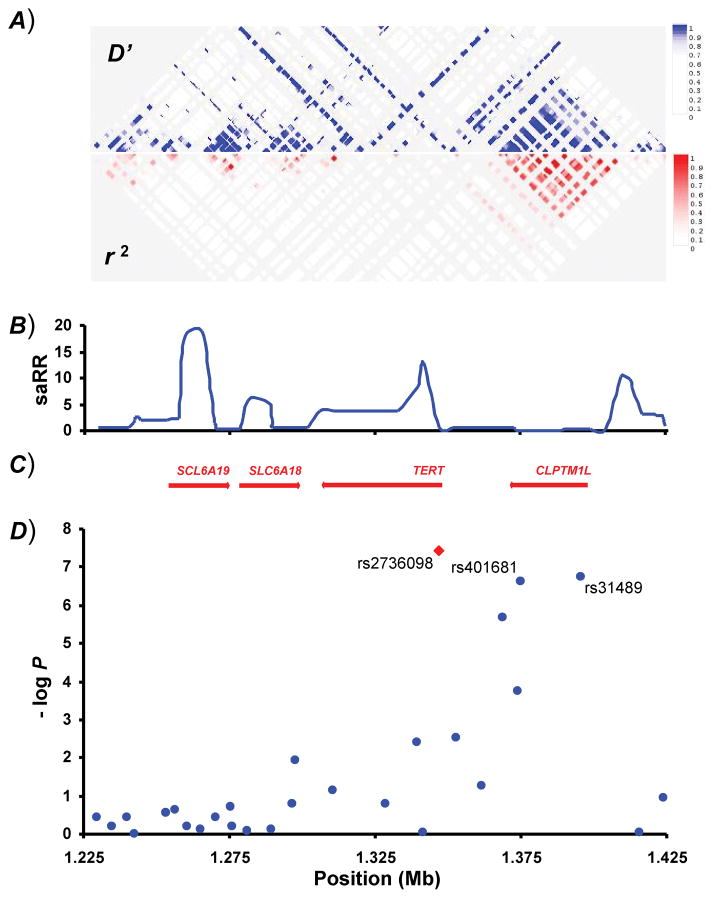
A schematic view of the association results and LD-structure in a region on chromosome 5p15.33. A) The pair-wise correlation structure in a 200 kb interval (1.225 – 1.425 Mb, NCBI B36) on chromosome 5. The upper plot shows pair-wise D′ for 100 common SNPs (with MAF > 5%) from the HapMap (v22) CEU dataset. The lower plot shows the corresponding r2 values. B) Estimated recombination rates (saRR) in cM/Mb from the HapMap Phase II data. C) Location of known genes in the region. D) Schematic view of the association with BCC in the Icelandic sample set consisting of cases genotyped by chip or in silico (blue dots). Red triangle shows the location of rs2736098 and corresponding significance of association to BCC, testing for the HapMap CEU markers absent on the chip for individuals directly genotyped on chip.

