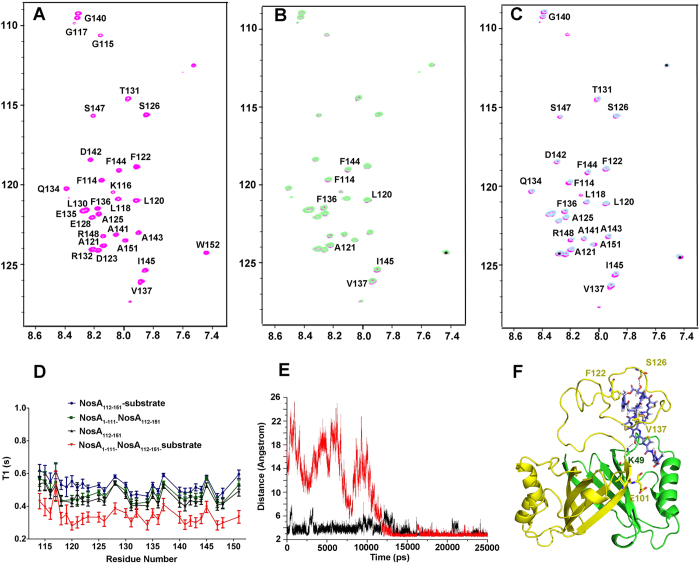
Figure 5. NosA1-111 coordinates with NosA112-151 to interact with the substrate.
(A) 1H-15N HSQC spectra acquired on free NosA112-151, highlighted with NMR signal assignment of residues; (B) 1H-15N HSQC spectrum of NosA112-151 in complex with the substrate (in green) was overlapped with that of free NosA112-151 (in pink); the signals with chemical shifts changes were marked; (C) 1H-15N HSQC spectrum of NosA112-151 in complex with NosA1-111 and substrate (in grey), overlapped with that of free NosA112-151 (in pink); the signals with chemical shifts changes were marked; In all cases of (A–C), the concentration of NosA112-151 was about 0.2 mM in NMR buffer. (D) Relaxation time T1 measurements of backbone atoms of each residue in 15N-labeled NosA112-151 in its free state (black), in complex with NosA1-111 (green), in complex with the substrate (blue), in complex with NosA1-111 and substrate (red), respectively. (E) Two hydrogen bonds between NosA and the substrate are formed, supported by the distance changes during MD simulation trajectory. The change in the distance between nitrogen atom of the side-chain of K49 and oxygen atom in –OH group in pyridine of the substrate is shown in black, and the change in the distance between the backbone oxygen of S126 and oxygen atom in –OH group in the substrate highlighted in blue in Fig. 1 is shown in red, respectively. (F) The last snapshot of the MD simulation trajectory, where the two monomers of NosA were displayed in green and yellown ribbon modes, respectively. The substrate was displayed in cyan-sticks mode. The main residues contributing to the protein-substrate interactions, including K49 and E101 in NosA1-111 and residues in NosA1-120, were also shown in sticks mode. The two hydrogen-bonds between NosA and substrate were displayed in dotted lines.

