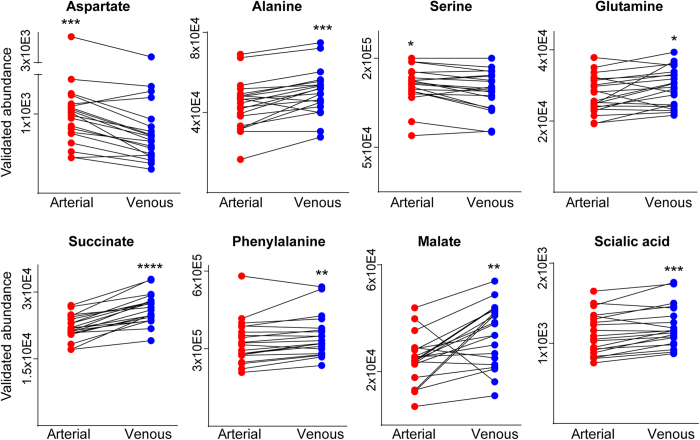
Figure 5. Metabolites that varied significantly after the blood circulation across the muscle tissue, as validated by targeted analysis.
Paired plots show the abundances of each metabolite in arterial and venous plasma of each individual. Significance level of Wilcoxon test is indicated by the number of stars.

