Figure 1.
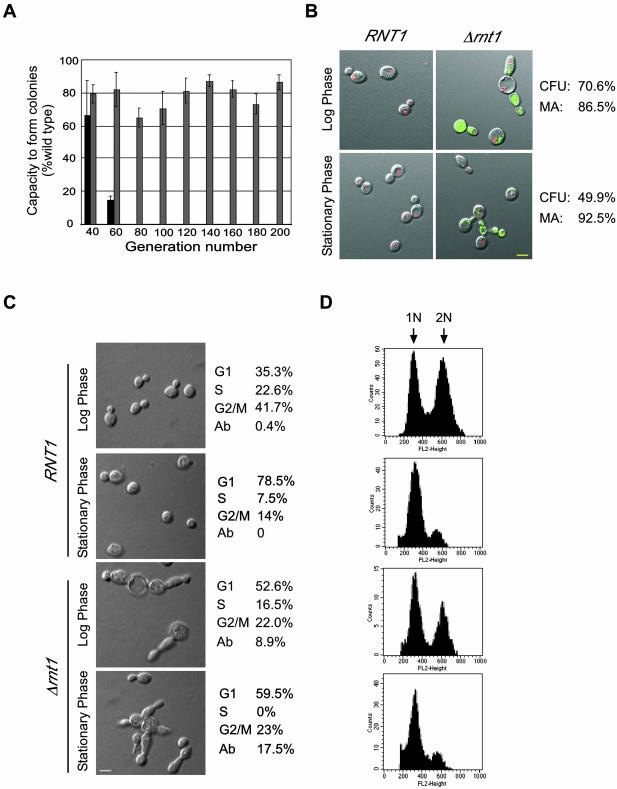
Deletion of RNT1 impairs colony formation and cell division. (A) Capacity of Δtlc1 (dark gray) and Δrnt1 (light gray) cells to form colonies over different generations is shown as a percentage of that obtained with wild-type cells (set to 100%). (B) Assay for cell vitality of Δrnt1 cells transformed with pRS315/GFP or pRS315/GFP/RNT1 and grown to either log or stationary phase. Transformation of the green FUN-1 dye to red demonstrates an active metabolism. The yellow colored bar represents 5 μm. The pictures shown depict cells after 30 min of incubation with the FUN-1 dye. The percentage of the cells that are metabolically active (MA) is shown on the right. Colony-forming units (CFU) of Δrnt1 cells under the same growth conditions are indicated on the right. (C) Phenotypic examination of Δrnt1 in comparison to wild-type cells from cultures growth to either log or stationary phases. The number of cells in each phase of the cell cycle was identified by observing the bud size. Abnormally large cells, those with very long bodies or buds and those with multiple buds were scored as abnormal (Ab). The yellow colored bar on micrographs represents 5 μm. (D) Cell analysis of Δrnt1 and wild-type by using flow cytometry. Cells were grown and analyzed as described in MATERIALS AND METHODS. Histograms of fluorescence intensity versus cell number are shown. 1N represents unreplicated DNA, whereas 2N represents replicated DNA.

