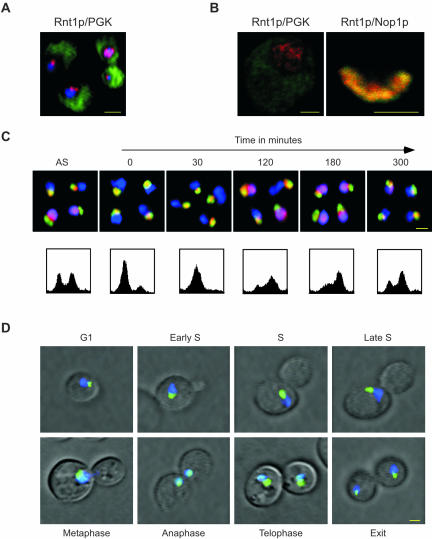
Figure 4.
Rnt1p shuttles between the nucleolus and the nucleoplasm during cell division. (A) In situ immunofluorescence analysis using the epifluorescence of wild-type cells immunostained with antibodies against Rnt1p (red) and PGK (green). The DAPI-stained DNA (blue) indicates the position of the nucleus. The yellow colored bar represents 2 μm. (B) In situ immunofluorescence analysis using confocal microscopy of wild-type cells double-stained for either Rnt1p in red and PGK in green (left), or Rnt1p in red and Nop1p in green (right). The yellow colored bar represents 1 μm. (C) In situ immunofluorescence of Rnt1p by using epifluorescence after the release of cells synchronized by α-factor in G1. Cells are shown before synchronization (AS), after synchronization (0) and at different times after release from α-factor (indicated in minutes). Rnt1p is labeled in red, Nop1p in green and DNA in blue. The lower panels show the FACS profiles of the cell culture at the time points indicated on top of the upper panel. (D) Determining the localization pattern of the GFP-Rnt1p fusion protein in living cells. Δrnt1 cells expressing the GFP-Rnt1p fusion (green) were incubated in SCD growth media with the DNA stain DAPI (blue) and observed using epifluorescence. Areas of overlap between Rnt1p and the DNA appear in light blue. Yellow bar, 2 μm. The cell cycle phase is indicated for each picture.

