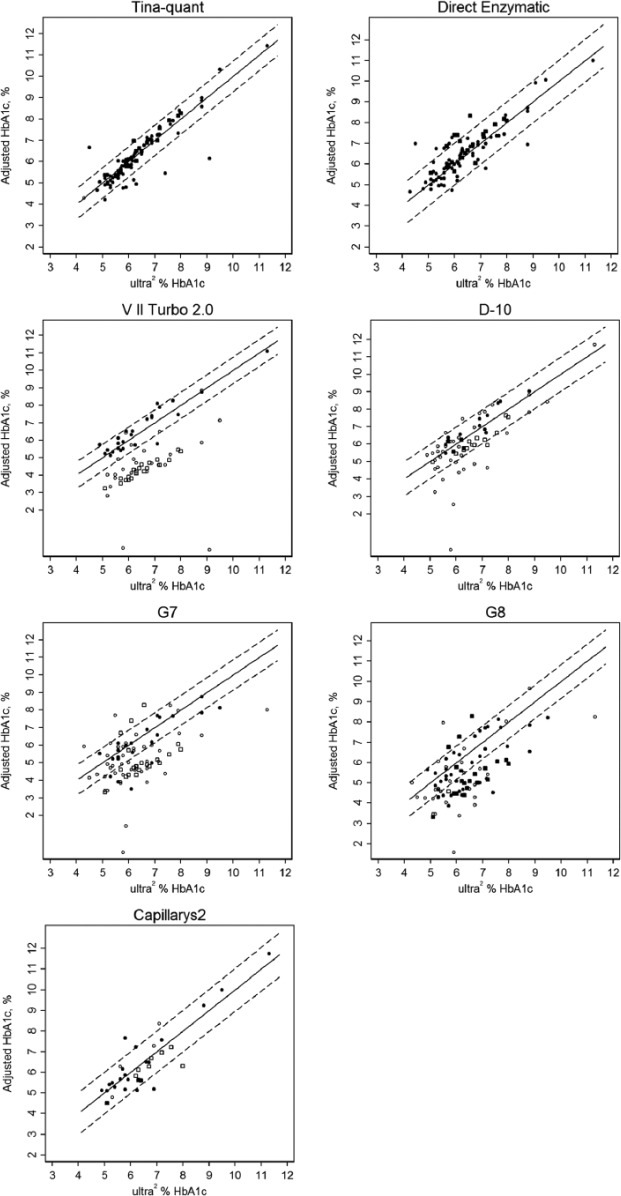
Figure 1.
Calibration-adjusted HbA1c results for rare Hb variant samples versus ultra2: Solid lines mark the equivalence (y = x); dashed lines indicate the 99% prediction intervals based on comparisons of HbA1c values of AA samples. Open circles are results that would not be reported; solid circles are results that would be reported; open and closed squares are for Hb J Baltimore specifically. HbA1c results for several variants were >12% and do not appear on the graphs. Hb Camperdown (n = 1), Hb Hope (n = 10), Hb Hopkins II (n = 1), Hb I (n = 3), Hb Raleigh (n = 1), and Hb Sherwood Forest (n = 1) were >15% on the VII Turbo 2.0. Results for Hb Camperdown (n = 1), Hb Hope (n = 10), and Hb Raleigh (n = 1) were >30% on the D-10. Hb Okayama (n = 1) and Hb Raleigh (n = 2) were >45% on the G7 and G8. Note: solid symbols outside the 99% prediction interval represent inaccurate results that would likely be reported.

