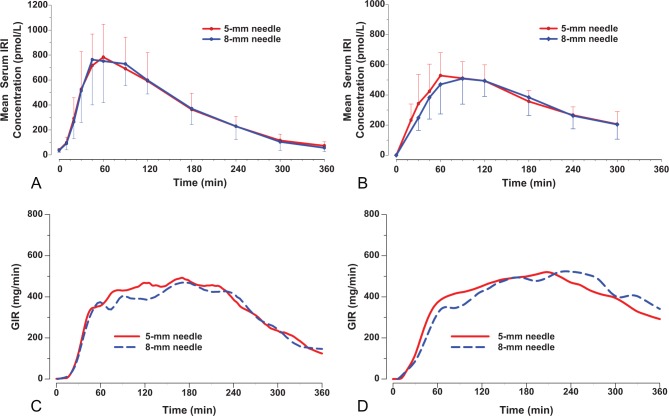
Figure 1.
Mean (± SD) serum immunoreactive insulin (IRI) concentration versus time profiles in normal weight subjects (A) and obese subjects (B), and locally weighted scatter plot smoothing (LOESS) fits of glucose infusion rate (GIR) versus time data in normal weight subjects (C) and obese subjects (D) following the administration of 0.25 U/kg insulin lispro at 5-mm and 8-mm injection depths.

