
Figure 6.
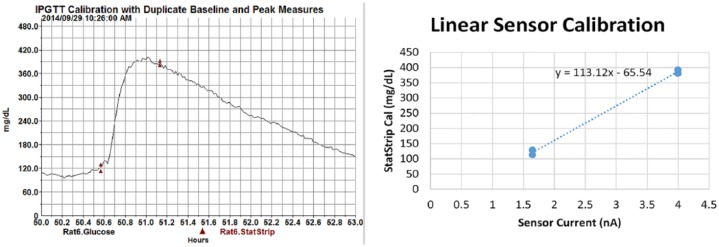
Device calibration showing use of duplicate samples and XY plot. Linear calibration provides individualized equation y = 113.1x − 65.5. Note the peak sampling time a few minutes after the observed telemetry peak to accommodate for time lag at the tail tip.