
Figure 6. Relative gene expression.
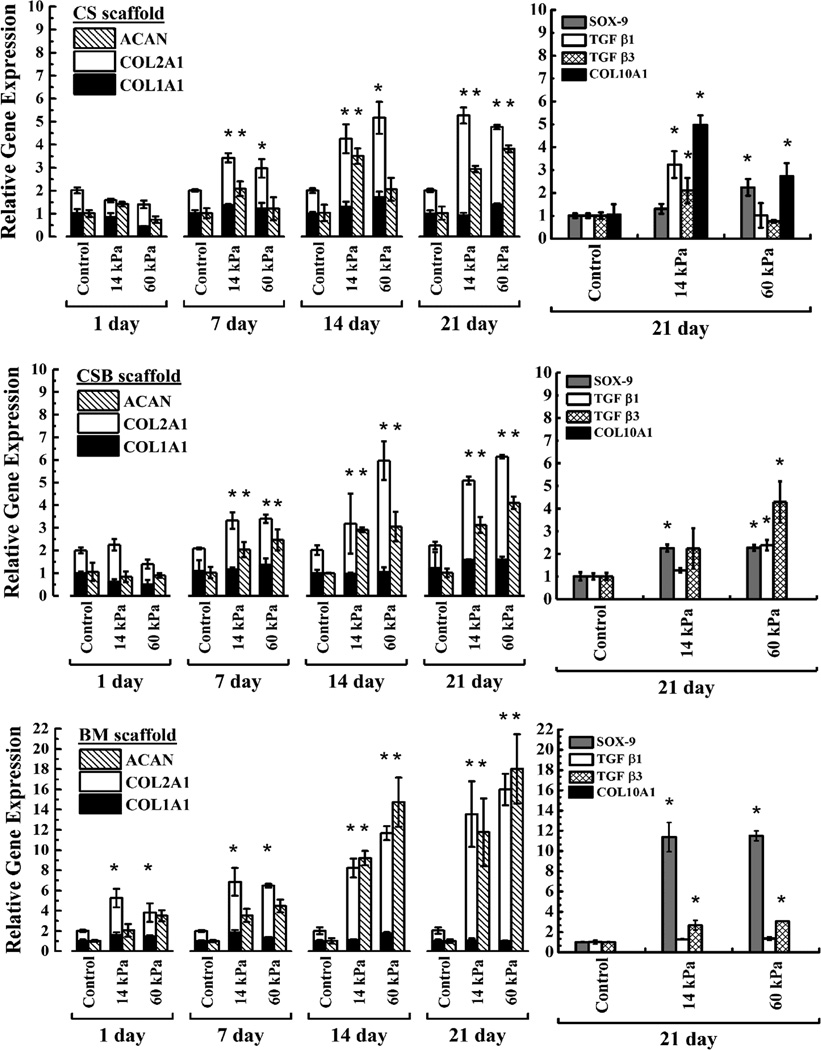
Relative gene expression analysis was performed using 2−ΔΔCT method on RNA isolated from cell seeded constructs at the end of 1, 7, 14 and 21 days of culture. The average values ± SD (n=3) were reported. Changes in the relative expression of COL2A1 to COL1A1 and Aggrecan as function of culture duration were shown in the left column. Right column depicts mRNA expression for SOX9, TGFβ1, TGFβ3 and COL10A1 only after 21 days of culture. Top, middle and bottom panels are showing gene expressions on CS, CSB and BM scaffolds respectively. At each time point, gene expression data obtained under US was compared with respective controls and, statistically significant data (p<0.05) are indicated with *. Statistically significant different data between two US conditions was shown with bracket.