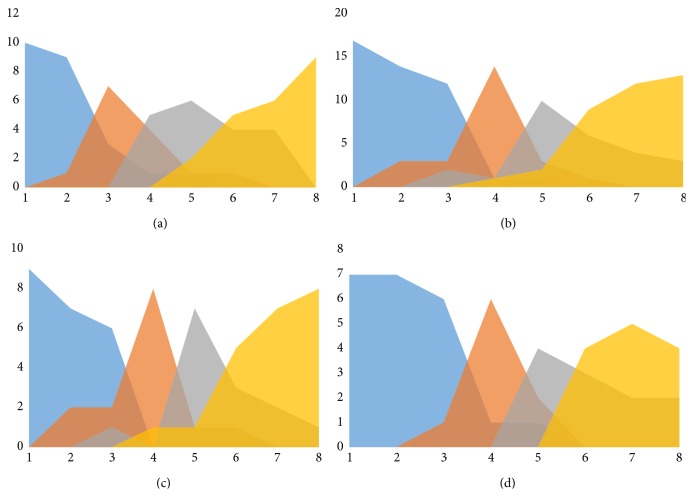
Figure 4.
Four graphs representing the effect of chemotherapy and age on the stage. (a) Patients not receiving chemotherapy. (b) Patients receiving chemotherapy demonstrate a long plateau stage 0 with delayed onset of bone formation at 6 months. When comparing the children and adults from this group (charts (c) and (d)) a rebound ingrowth and shorter period between stages 2 and 3 and reaching stage 3 earlier are observed.

