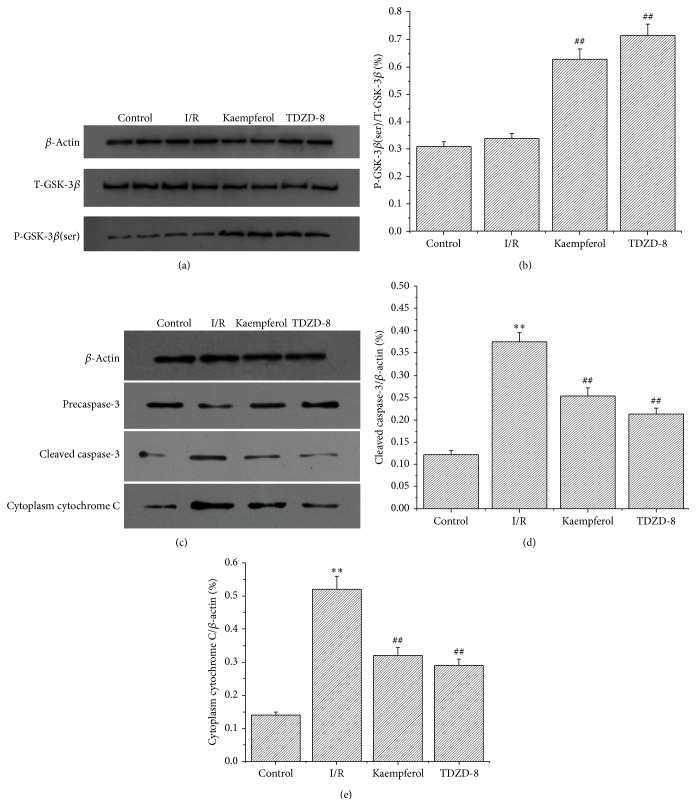
Figure 5.
Kaempferol increases the phosphorylation of GSK-3β and reduces the release of cytochrome C and the dissociation of caspase-3. (a) Representative Western blots for T-GSK-3β and P-GSK-3β (Ser9). Lanes 1 and 2 are the control group, lanes 3 and 4 are the I/R group, lanes 5 and 6 are the kaempferol group, and lanes 7 and 8 are the TDZD-8 group. (b) Grey value analysis demonstrates that kaempferol increases the ratio of P-GSK-3β (ser)/T-GSK-3β. (c) Representative Western blot for cleaved caspase-3 and cytoplasm cytochrome C. Lane 1 is the control group, lane 2 is the I/R group, lane 3 is the kaempferol group, and lane 4 is the TDZD-8 group. (d) Grey value analysis demonstrates that kaempferol reduces the ratio of cleaved caspase-3/β-actin. (e) Grey value analysis demonstrates that kaempferol reduces the ratio of cytoplasm cytochrome C/β-actin. Values are presented as means with their standard deviations (, n = 8); ∗∗ P < 0.01, compared with the control group; ## P < 0.01, compared with the I/R group.

