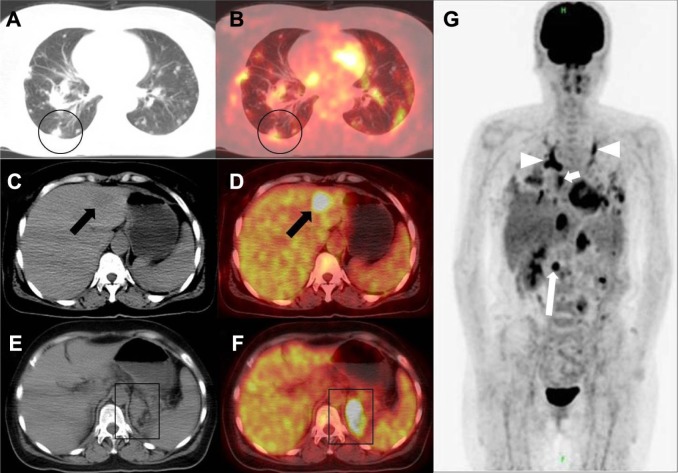
Figure 2.
The 18F-FDG PET/CT scans of the patient.
Notes: (A and B) Axial CT image in the lung window and axial PET/CT fusion image at the level of inferior pulmonary vein. Circles: pulmonary metastases. (C and D) Axial CT image in the abdominal window and axial PET/CT fusion image at the level above hepatic portal. Arrows: liver metastases. (E and F) Axial CT image in the abdominal window and axial PET/CT fusion image at the level of hepatic portal. Boxes: metastatic foci growing from previous left kidney bed. (G) Maximum intensity projection image 18F-FDG PE T showed tumor emboli in bilateral upper pulmonary artery (arrowheads), left atrium (short arrow), and inferior vena cava (long arrow).
Abbreviations: CT, computed tomography; FDG, fluorodeoxyglucose; PET, positron emission tomography.

