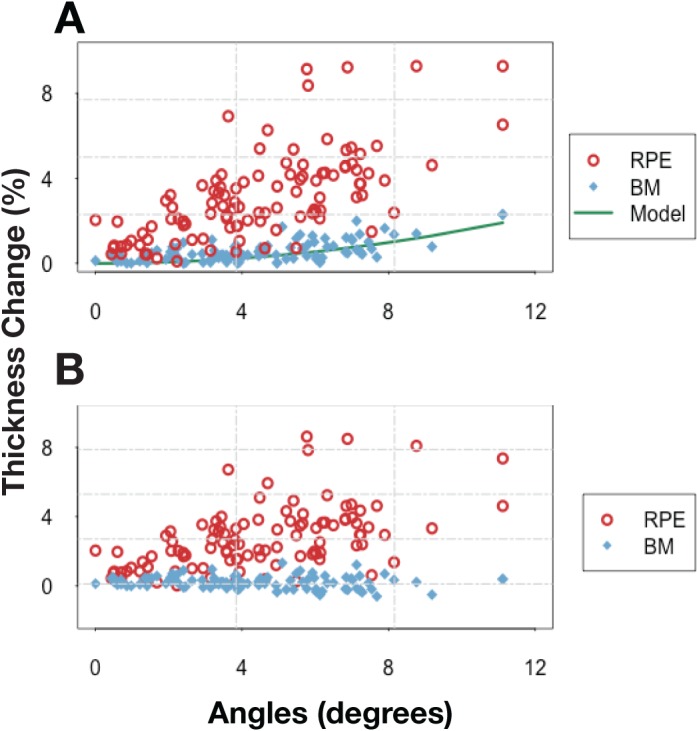
Figure 5.

(A) Scatterplot depicting the change in TRT (%) when using the RPE (red circle) and Bruch's membrane (blue diamond) as the reference surface with respect to the angle of tilt in the images. The geometry-induced error that was modeled (green) is presented for comparison. (B) The thickness change (%) noted when using the RPE and Bruch's membrane after accounting for the geometry-induced errors.
