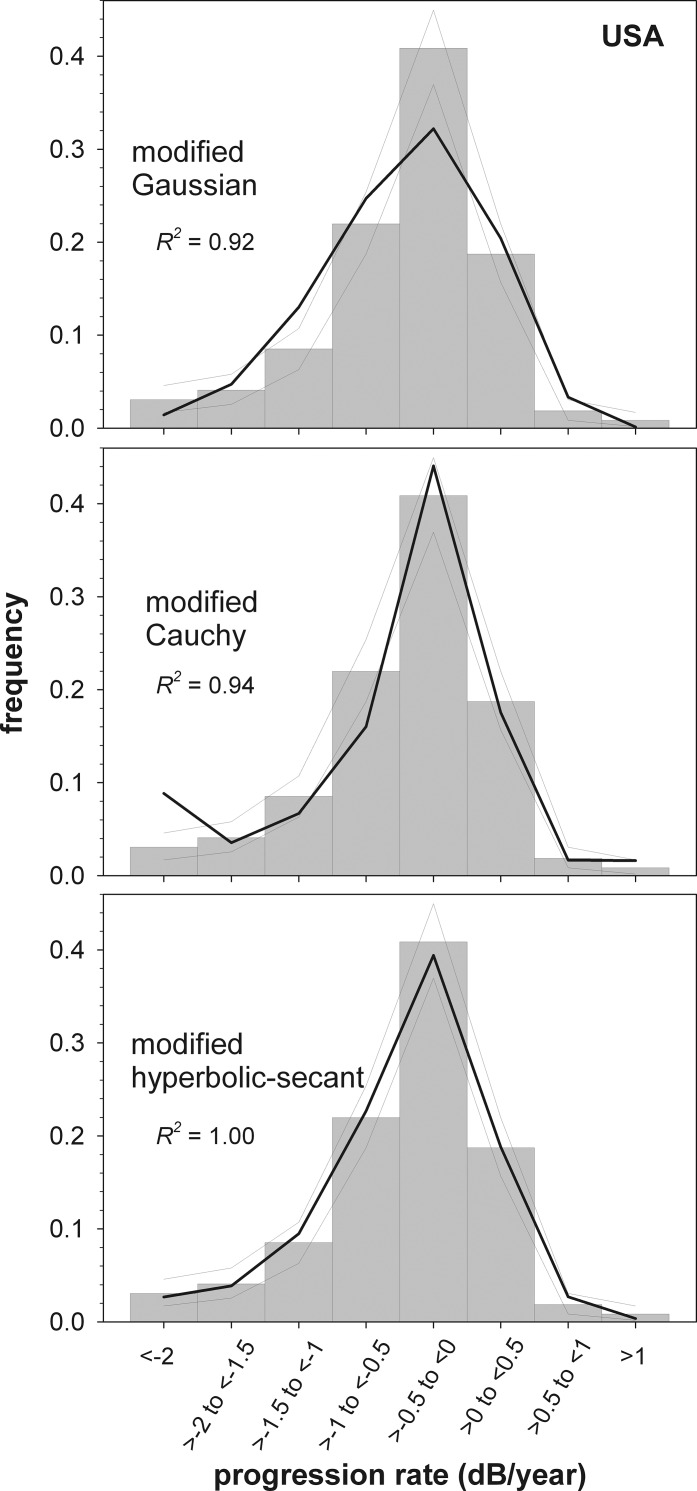
Figure 3.
Maximum-likelihood fits of the three parametric models to the distribution of visual field progression rates patients from the New York Glaucoma Progression Study, derived from data reported by De Moraes et al.2 The upturn in the leftmost point of the modified Cauchy results from the unequal bin widths used for these data: for this model, more people are predicted to have progression rates between −2 and −10 dB/yr (the limit to which rates were calculated in the current paper) than between −2 and −1.5 dB/yr. Remaining details are as given for Figure 1.

