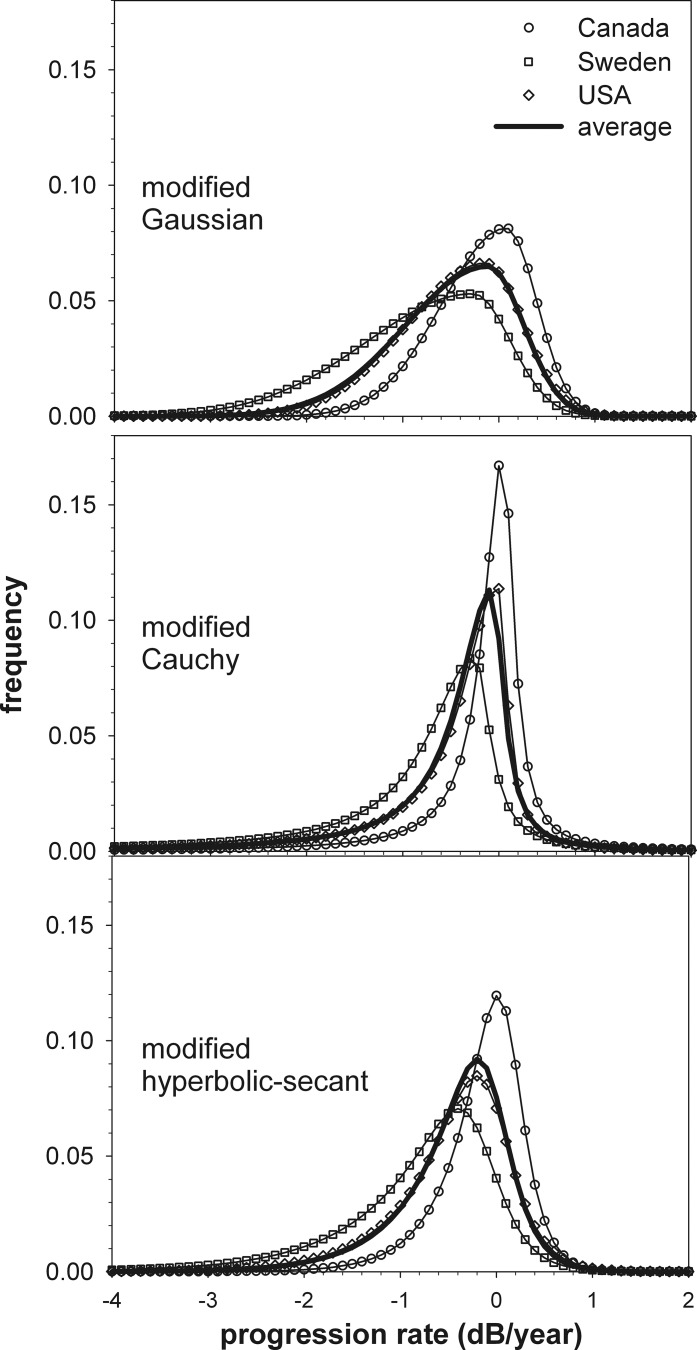
Figure 4.
Comparison of the maximum likelihood fits for the three datasets and the three models, along with models using the average parameters of the fits to the three datasets. Model fits for the Sweden and US data sets are as given in Figures 2 and 3 except with histogram frequencies represented in 0.1-dB/yr wide bins.

