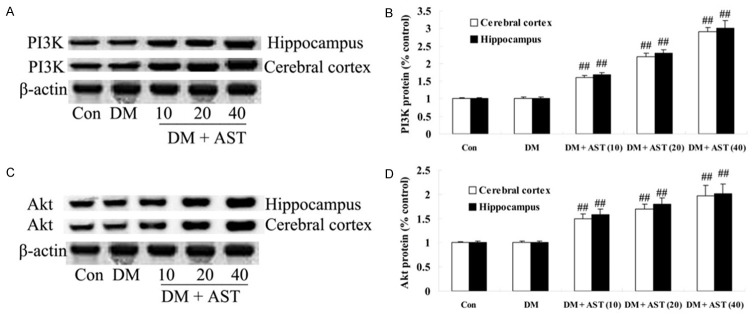
Figure 7.

Effect of AST on diabetes-induced changes in the expression of PI3K/Akt. Indicated representative western blotting analysis of PI3K and Akt protein levels (A and C) and statistical analysis of PI3K and Akt protein level (B and D). ##P<0.01 compared with DM group. Con, control; DM, diabetes; DM + AST (10), AST (10 mg/kg)-treated group; DM + AST (20), AST (20 mg/kg)-treated group; DM + AST (40), AST (40 mg/kg)-treated group.
