
Figure 5.
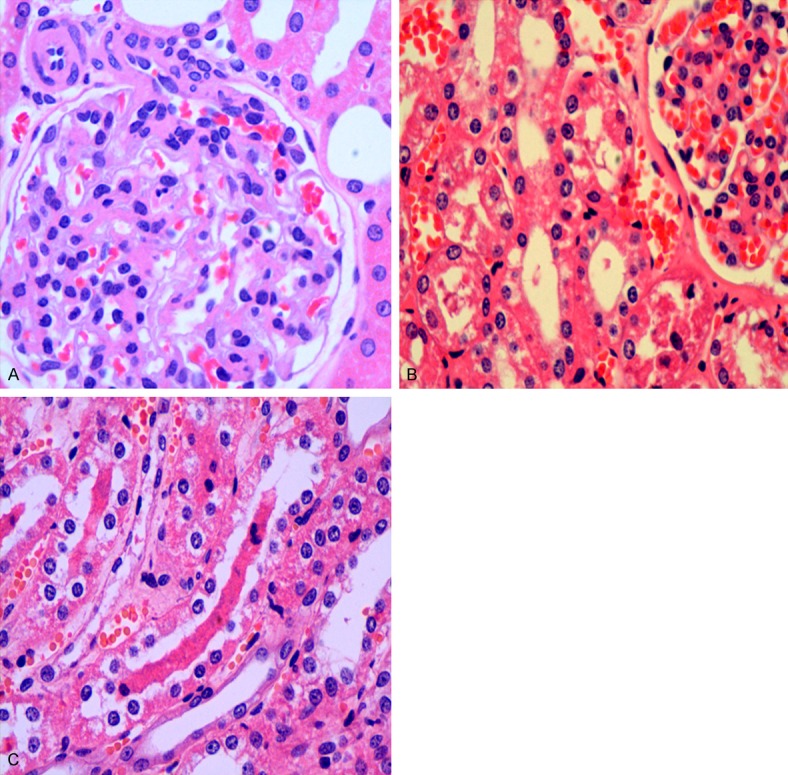
The pathological analysis of renal tissues. A: Control group HE staining ×400; B, C: Experimental group HE staining ×400.
Official websites use .gov
A
.gov website belongs to an official
government organization in the United States.
Secure .gov websites use HTTPS
A lock (
) or https:// means you've safely
connected to the .gov website. Share sensitive
information only on official, secure websites.
The pathological analysis of renal tissues. A: Control group HE staining ×400; B, C: Experimental group HE staining ×400.