
Figure 3.
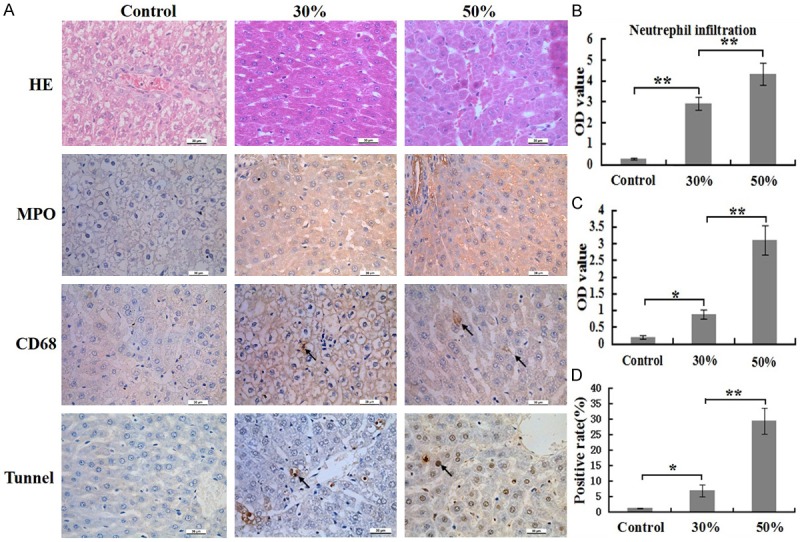
Comparison of inflammatory cells numbers and cells apoptosis rates of liver at 24 h post burn in 30%, 50% TBSA with a full-thickness burn groups and control group. A. The inflammatory cells infiltrations and cells apoptosis rates in liver were assessed by H&E staining, immunohistochemistry and Tunnel detection. B. A quantitative analysis of positive staining for neutrophils (MPO) is shown in the corresponding histogram. C. A quantitative analysis of positive staining for macrophages (CD68) is shown in the corresponding histogram. D. A quantitative analysis of positive staining for apoptosis cells is shown in the corresponding histogram. Values are represented as mean ± SD (n=8), asterisk (*) stands for P < 0.05 and double asterisk (**) stands for P < 0.01.