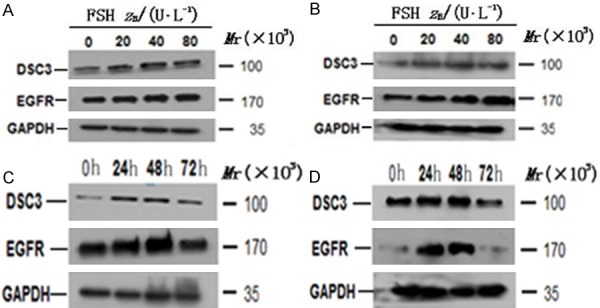
Figure 2.

A and B. Effect of FSH of different concentrations on Dsc3 and EGFR expression detected by Western blotting analysis. A. Hey cells; B. HO8910 cells. C and D. Dsc3 and EGFR expression in Hey cells and HO8910 cells after treatment with FSH at the optimal concentration of 40 IU/L. C. Hey cells; D. HO8910 cells.
