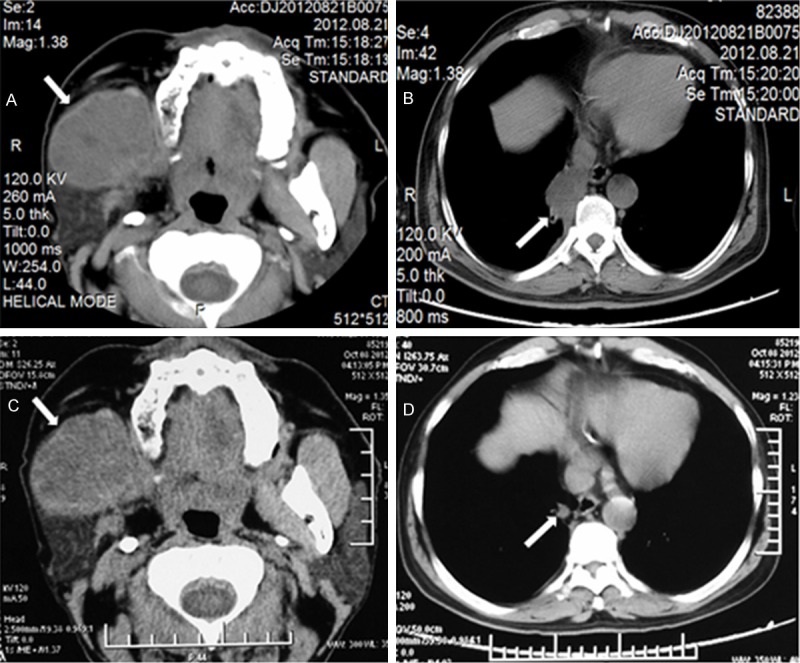
Figure 3.

The computerized tomography images of the patient after the chemotherapy. A. After the fourth cycle chemotherapy, the soft tissue mass in the right maxillofacial was seen in front of parotid, which maximum diameter was about 5 × 4.4 cm (white arrow). B. After the fourth cycle chemotherapy, the soft tissue mass was seen in the right lung, which maximum diameter was about 2.9 × 2.3 cm (white arrow). C. After the sixth cycle chemotherapy, the soft tissue mass was seen in the right maxillofacial, which maximum diameter was about 4.9 × 4.2 cm (white arrow). D. After six cycles chemotherapy and radiotherapy, the soft tissue mass in the right lung was 0.9 × 0.7 cm (white arrow).
