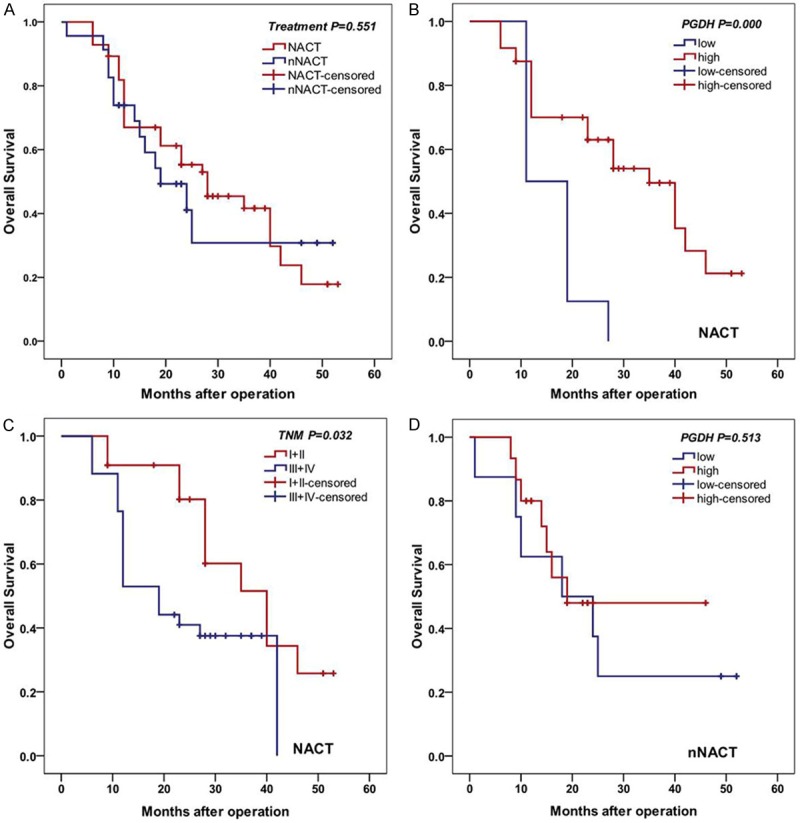
Figure 3.

Kaplan-Meier analysis of OS. A. There was no significant difference of OS between patients’ treatment with and without NACT (log-rank test, P=0.551). B. Patients with NACT with higher 15-PGDH expression had longer OS (log-rank test, P<0.001). C. Patients with I/II stage had longer OS (log-rank test, P=0.032). D. No significant difference was seen between expression level of 15-PGDH in patients without NACT (log-rank test, P=0.513).
