
Figure 2.
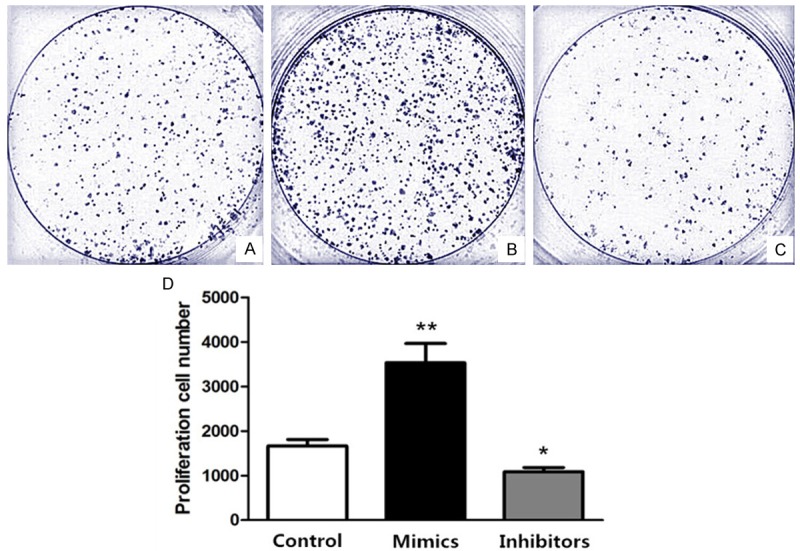
Proliferation effect comparison among differently treated HT-29 cells. Group A. Treated with the same dose of D-Hanks liquid; Group B. Transfected with miR-155-5p mimics; Group C. Transfected with miR-155-5p inhibitor. D. Cell number was counted by Coulter Counter on 2nd day and statistically analyzed, compared with control group, *P<0.05, **P<0.01.