
Figure 1.
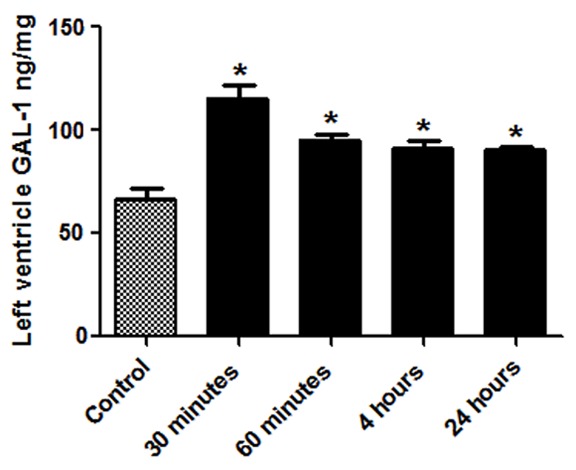
Graphical representation of the Galectin-1 levels in the LV at different post operated time points. *Shows P<0.05 in non-operated control vs surgically operated groups.
Official websites use .gov
A
.gov website belongs to an official
government organization in the United States.
Secure .gov websites use HTTPS
A lock (
) or https:// means you've safely
connected to the .gov website. Share sensitive
information only on official, secure websites.
Graphical representation of the Galectin-1 levels in the LV at different post operated time points. *Shows P<0.05 in non-operated control vs surgically operated groups.