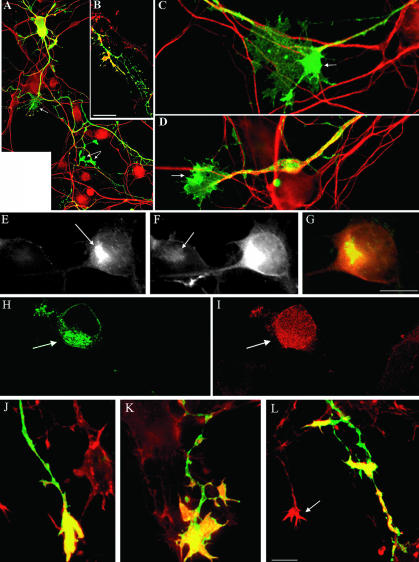
Figure 6.
Effect of the expression of HA-tagged wt-LIMK1 on neuronal morphology. For this experiment, the cells were transfected with 6 μg of HA-tagged wt-LIMK1 and fixed 12 (A-I), 20 (J and K), and 24 (L) h later. The cells were stained with a rabbit polyclonal antibody against HA (green) and either tyrosinated α-tubulin (red in A, C, and D) or rhodamine-phalloidin (red in B, I and L), or p-cofilin (F). (A-D) Image in A shows the general morphology of a neuron overexpressing wt-LIMK1; note the presence of growth cone-like structures along the axon (arrows). The image in B shows accumulations of F-actin at the tip of neuritic branches of the transfected neuron. The image in C shows a high power view of a growth cone located along an axonal process; note the accumulation of LIMK1 (arrow) at the periphery of the growth cone. These accumulations also are observed in growth cones located at the tip of neuritic processes (arrow in D). (E-G) Double immunofluorescence micrographs showing the distribution of HA-tagged wt-LIMK1 (E) and phospho-cofilin (F) in a cultured hippocampal pyramidal neuron 12 h after transfection. Note the dramatic increase in phospho-cofilin fluorescence intensity in the Golgi region of the transfected cell compared with a nontransfected one (arrow in F). (G) Red-green overlay of the images shown in E and F. (H and I) Confocal images showing the distribution of HA-tagged LIMK1 (H) and rhodamine-phalloidin (I) in cultured neurons; note the intense phalloidin staining of the Golgi region (arrow) in the transfected neuron. (J and K) Confocal images showing examples of growth cones 20 h after transfection with wt-LIMK1. These growth cones have abnormal shapes, are several times larger than the ones of nontransfected cells (arrow in L) and stained strongly for F-actin. (L) This image shows an example of a neuritic tip (green-yellow) of a neuron overexpressing wt-LIMK1 24 h after transfection. Note the disappearance of the growth cone and the presence of patches of F-actin along the distal end of the neuritic process. Bars, 15 μm (A and B) and 10 μm (C-L).

