Figure 3.
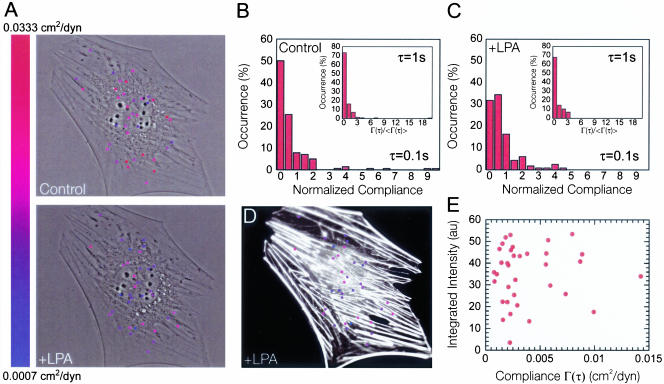
Effect of LPA treatment on the microheterogeneity of the cytoplasm. (A) Phase contrast micrographs of a serum-starved Swiss 3T3 cell overlaid with fluorescent micrographs of fluorescent microspheres injected into the cytoplasm before and 15 min after treatment with 1 μg/ml LPA. Here, we only show tracked particles and have neglected aggregates that violate assumptions made in the generalized Stokes-Einstein relationship. Each particle position was color-coded corresponding to the local value of the cellular compliance at that position in the cell at a time scale of 1 s. Note that the color indicators at each particle position do not reflect the size of the particle (0.1 μm). Indicator size was increased to aid visual presentation. (B and C) Distribution of local cellular compliances within the cytoplasm of serum-starved Swiss 3T3 cells before (B) and 15 min after (C) treatment with 1 μg/ml LPA measured at a time scale of 1 s. Inset, subcellular distribution of local cellular compliance measured at a time scale of 0.1 s. (D) Fluorescent micrograph of the cell shown in (A) overlaid with fluorescent micrographs of fluorescent microspheres injected into the cytoplasm. The cell was fixed 15 min after treatment with 1 μg/ml LPA and stained with Alexa 566 phalloidin to visualize actin filaments (white). Each particle position was color coded as described above. (E) F-actin bundle intensity integrated over the area covered by each particle region displayed in A and plotted against the local value of the cellular compliance at a time scale of 1 s.

