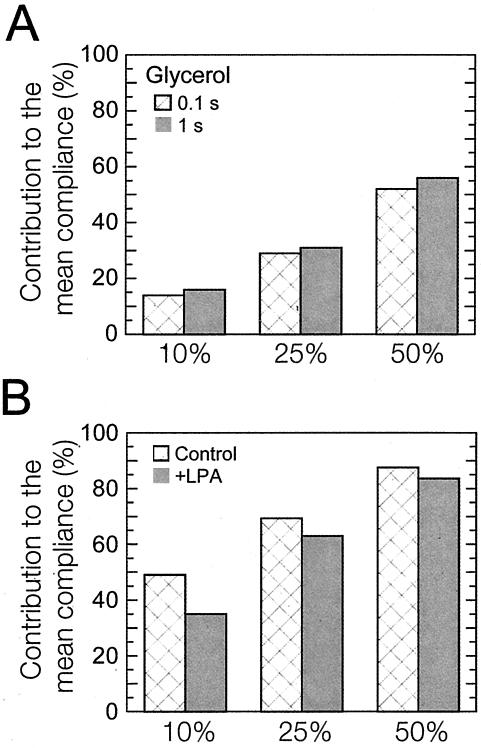
Figure 4.
Statistical analysis of cellular compliance distributions. (A) Percentage of contributions of the highest 10, 25, and 50% values of local compliance to the mean compliance in a glycerol solution measured at a time scale of 0.1 s (first columns) and 1.0 s (second columns). These contributions are close to the expected values for a perfectly homogeneous solution, i.e., 10, 25, and 50%. (B) Contributions of the highest 10, 25, and 50% values of local compliance to the mean compliance of quiescent Swiss 3T3 cells before (first columns) and after (second columns) treatment with 1 μg/ml LPA.

