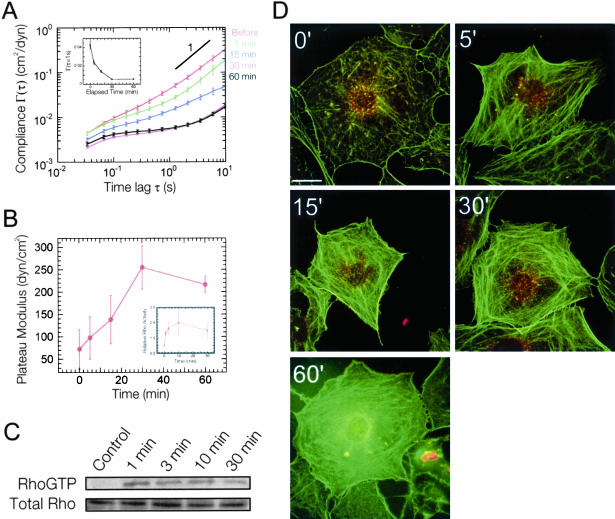
Figure 8.
Cytomechanical response of Swiss 3T3 cells to Rho activation and Rho kinase inhibition. (A) Time-dependent mean cellular compliances directly computed from the mean-squared displacements of the thermal motions of microspheres injected into the cytoplasm of Y-27632 (10 μM)-treated, serum-starved Swiss 3T3 cells before and after treatment with 1 μg/ml LPA. Error bars denote SE of measurement. Inset, cellular compliance as a function of elapsed time at a time scale of 1 s. (B) Time-dependent plateau modulus obtained from mean cellular compliances (A). Inset, relative Rho activity (blue) obtained from Western blots of Rho pull-down experiments (C). Values are means obtained from four experiments ± SD. (C) Western Blot from one Rho pull-down experiment. (D) Time-dependent fluorescent micrographs of Y-27632 (10 μM)-treated, serum-starved Swiss 3T3 cells before and after treatment with 1 μg/ml LPA. Actin filaments (green) were visualized with Alexa 488 phalloidin, whereas focal adhesion complexes (red) were visualized with a mAb against vinculin and Alexa 566 goat anti-mouse. Bar, 20 μm.

