Figure 4.
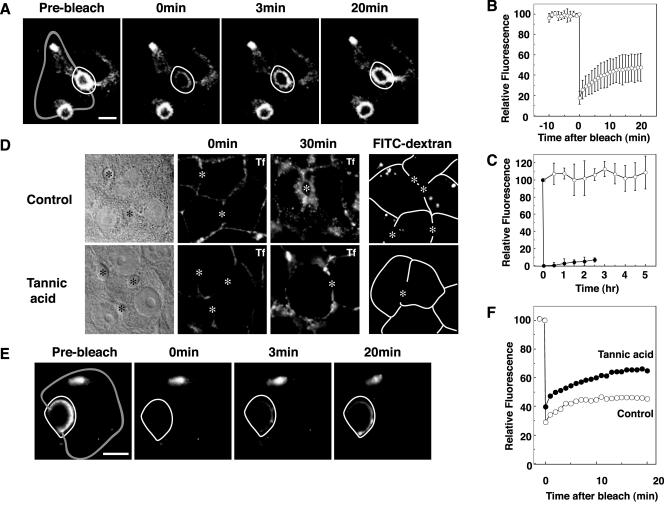
Canalicular BSEP pool constitutively exchanges with other intracellular pools. Also see Videos 1 and 4. WIF-B9 cells infected with BSEP-YFP adenovirus were used for live cell imaging by confocal or conventional fluorescent microscopy at 37°C. (A) Canalicular membrane region BSEP-YFP recovers after photobleach. The area enclosed by a white line was photobleached. Time in the next two panels denotes minutes postbleach. Gray line shows basolateral membrane. (B) Quantitation of BSEP-YFP recovery in the canalicular membrane region after photobleaching (as in A). Mean fluorescence intensity was determined at the times indicated. n = 6 ± SD. (C) Synthesis and degradation of BSEP-YFP. To determine BSEP-YFP synthesis rate, WIF-B9 cells infected with BSEP-YFP adenovirus were photobleached throughout the cell. Fluorescence images were captured at 30-min intervals (solid circles, n = 6 ± SD). To determined BSEP-YFP degradation rate, WIF-B9 cells infected with BSEP-YFP adenovirus were treated with cycloheximide (50 μg/ml). Fluorescence images were captured at 30-min intervals (open circles, n = 6 ± SD). (D) Tannic acid blocked basolateral endocytosis. WIF-B9 cells were incubated with (bottom) or without (top) tannic acid (0.5%) in serum-free medium for 5 min at 37°C. Cells were washed and assayed for uptake of Cy5-conjugated transferrin (Tf) in serum-free medium after 30-min incubation at 0°C (center) or 37°C (right), or uptake of fluorescein isothiocyanate conjugated dextran (mol. wt. 580,000) after 10-min incubation at 37°C. Bile canaliculus is indicated by asterisk. Transferrin and dextran were endocytosed from basolateral membrane in control cells. Tannic acid treatment impaired transferrin and dextran endocytosis from the basolateral membrane. Bile canaliculus is indicated by asterisk. White line shows basolateral membrane. (E) WIF-B9 cells infected with BSEP-YFP adenovirus were incubated with tannic acid (0.5%) in serum-free medium for 5 min at 37°C. The cells were washed and the area enclosed by the white line was photobleached. Time in the second two panels denotes minutes postbleach. Gray line shows basolateral membrane. (F) Quantitation of BSEP-YFP recovery in the canalicular BSEP pool after tannic acid treatment. The canalicular membrane region was photobleached as shown in E. Fluorescence intensity was determined at the times indicated. Open circles denote control values and solid circles are values after tannic acid treatment. (E and F) Tannic acid did not alter BSEP-YFP recovery in the canalicular region.

