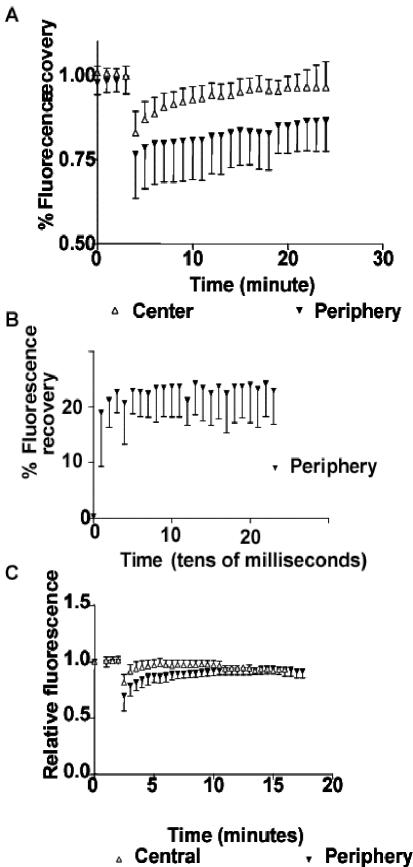
Figure 10.
FRAP of GFP-MLC (expressed in gerbil fibroma cells) or GFP-α-actinin (expressed in Swiss 3T3 fibroblasts). (A) Greater exchange of GFP-MLC occurs in central regions than in peripheral zones. The t1/2 of GFP-MLC in central regions is 8.5 min (n = 14), whereas that for peripheral spots is t1/2 > 21 min after photobleaching (N = 9). (B) Fast phase of fluorescence recovery due to passive diffusion of GFP-MLC shows ∼21% recovery of prebleach fluorescence within the first 10 msec after bleaching before plateauing before beginning the slow phase of active recovery depicted in A. (C) GFP-α-actinin recovers after photobleaching with a t1/2 = 2.5 min in central regions and 4 min in peripheral regions with essentially full recovery by 8-10 min in both regions.

