Figure 7.
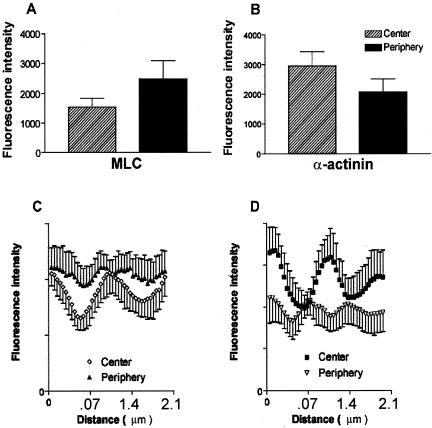
Fluorescence intensity of antibody-labeled MLC and α-actinin measured in the central and peripheral regions of stress fibers of extracted cells that have been treated with 5 nM calyculin A. (A) Gerbil fibroma cells have higher fluorescence intensity per μm2 and therefore a greater concentration of MLC at the periphery. (B) Fluorescence intensity and concentration of α-actinin is greater in central stress fiber regions. Line scans of fluorescence intensities along stress fiber segments show differences in intensities and periodicities of antibody-labeled MLC and α-actinin between the center and the periphery after calyculin A stimulation. Multiple line scans were aligned as described in the text for MLC (C) or α-actinin (D). MLC is less concentrated and has longer periodicities in central regions than in peripheral regions (C). (D) The average central periodicity between α-actinin peaks is greater than that in the periphery. Fluorescence intensities display the reverse relationship to that found for MLC. Higher α-actinin fluorescence occurs in central regions than in peripheral regions.

