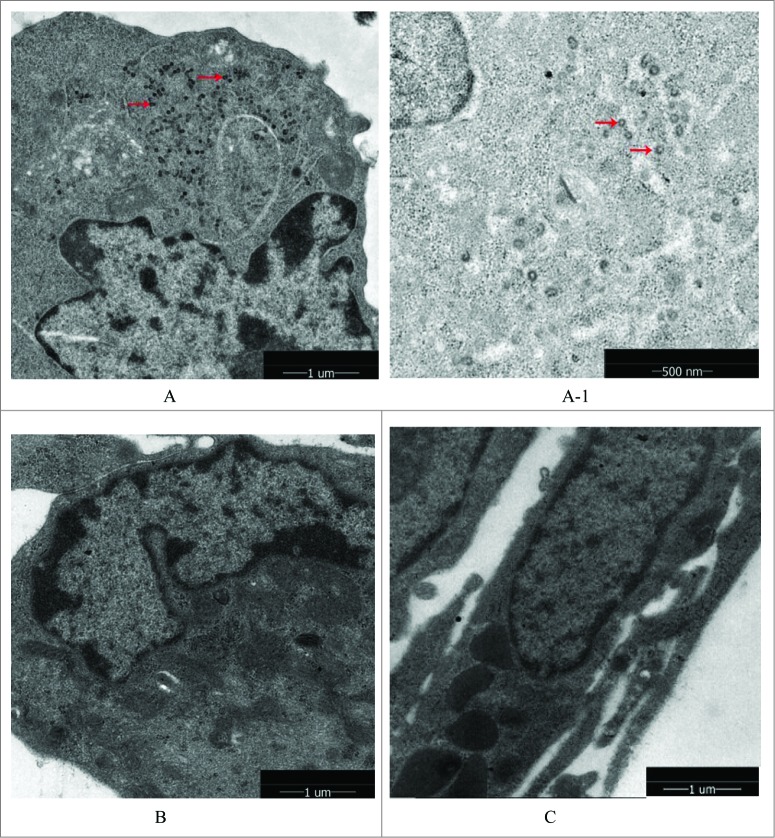
Figure 6.
Retrovirus tests of Walvax-2. The results were observed by mirror electron microscopy(200Kv 5000x/160Kv 7800x). The arrows point to virus particles detected as shown in the picture. (A) and (A-1) were represented positive controls (Sp2/0-Ag14), (A-1) was partial enlarged detail of (A). (B) was represented negative control (MRC-5). (C) was represented the cells of Walvax-2 of the 24th passage.

