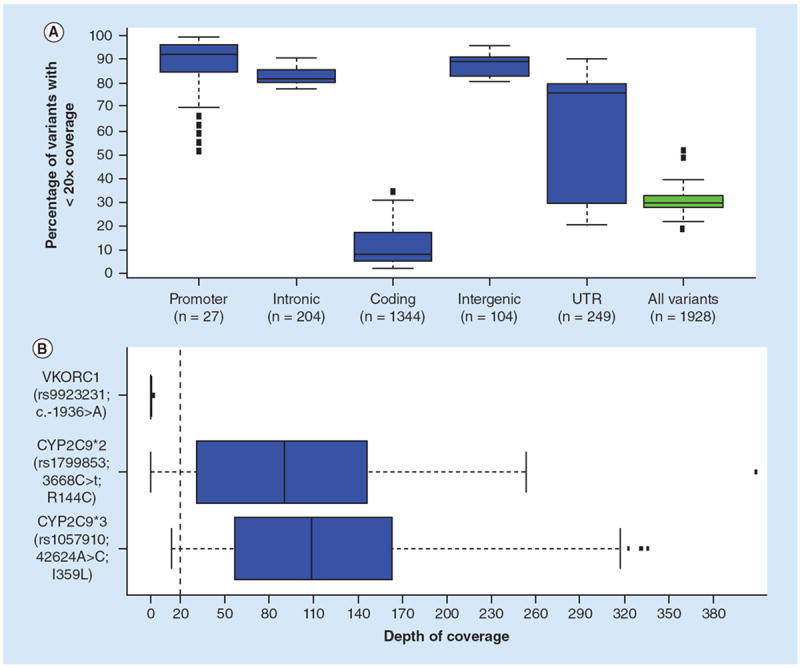
Figure 2. Box plots showing coverage of pharmacogenomic variants by exome sequencing.

The boxes represent the 25th to 75th quartiles with the median value indicated by the black line for all 62 samples; the whiskers are 1 standard deviation from the interquartile values and the circles represent outliers. (A) Plotted are the distributions of coverage for the variants broken down by genomic region of each variant. Each graph represents all 62 samples and the number of variants at each genomic location is indicated. The y-axis is the percent of variant positions with less than 20x depth of coverage. (B) The depth of coverage for the three variants used for therapeutic dosing of warfarin. The x-axis is the depth of coverage for each of the three variants. The dashed red line indicates a 20x coverage threshold used.
UTR: Untranslated Regions.
