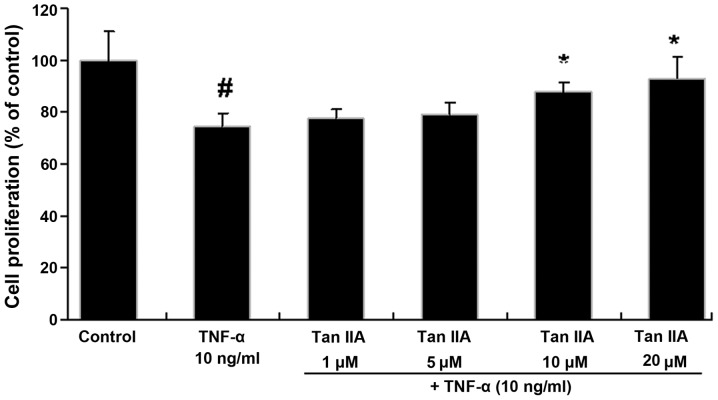
Figure 2.
Proliferation of EPCs in response to TNF-α and Tan IIA, as determined using an MTT assay. EPC proliferation was decreased by TNF-α and restored by Tan IIA treatment. EPCs without treatment served as the control group. Values are presented as the mean ± standard deviation (n=5). #P<0.01 vs. control group; *P<0.05 vs. TNF-α group. EPCs, endothelial progenitor cells; TNF-α, tumor necrosis factor-α; Tan IIA, tanshinone IIA.

