Figure 2.
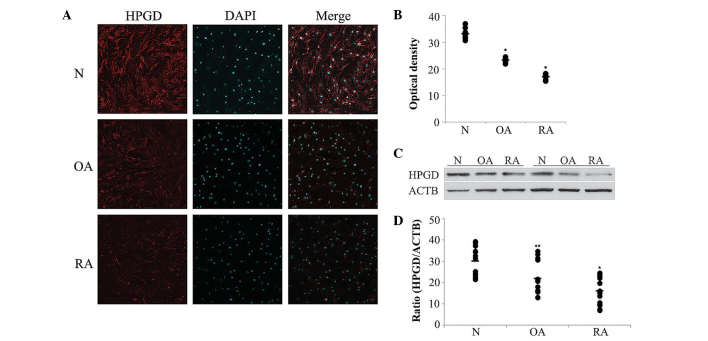
Expression of HPGD in FLS from N individuals, patients with OA and patients with RA. (A) Confocal microscopy images demonstrated immuno-histochemical staining for HPGD (red; Cy3) with DAPI, in FLS (scale bar, 50 µm; n=12). (B) Quantification of the images from (A) using ImageJ software. (C) The expression of HPGD in the FLS from N individuals, patients with OA and patients with RA. ACTB was used as an internal control. (D) Graph demonstrating the ratio of HPGD to ACTB as determined by ImageJ software (*P<0.001, **P=0.005, compared with N). N, normal; OA, osteoarthritis; RA, rheumatoid arthritis; HPGD, 15-hydroxyprostaglandin dehydrogenase; FLS, fibroblast-like synoviocytes, ACTB, β-actin.

