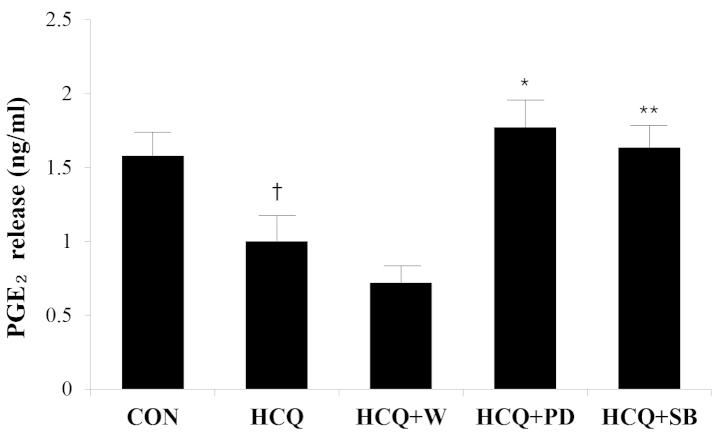
Figure 8.
Levels of PGE2 release upon hydroxychloroquine stimulation by wortmannin, PD98059 and SB203580. The quantities of PGE2 and 6-keto-PGF1α were measured by enzyme immunoassay. Wortmannin (1 nM), PD98059 (10 µM) and SB203580 (50 µM) were added to the cells 0.5 h prior to HCQ (10 µM) stimulation. The data are expressed as the mean ± standard deviation (1.78±0.18, *P= 0.02; 1.63±0.15, **P= 0.031, compared with HCQ and 1.00±0.17, †P=0.050, compared with the CON). PGE2, prostaglandin E2; CON, control; HCQ, hydroxychloroquine; W, wortmannin; PD, PD98059; SB, SB203580.

