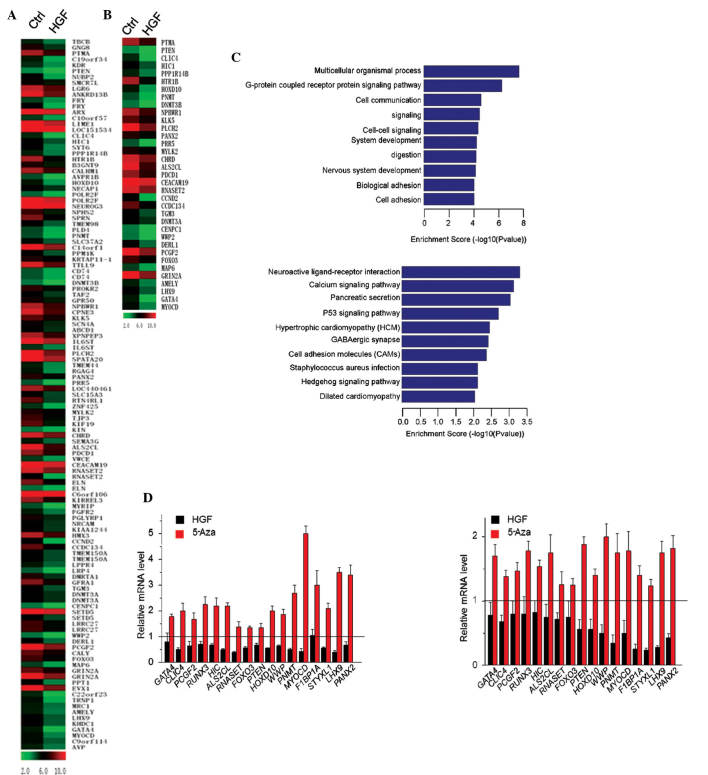
Figure 5.
Integrated analysis of gene expression and DNA methylation. (A and B) Expression heatmap of genes regulated by HGF and DNA methylation in HL-7702 cells. (A) A total of 89 genes were screened out; (B) 35 of these were associated with cell proliferation, apoptosis, cell cycle, and metastasis. (C) The 89 potential target genes that were subjected to gene ontology analysis (top) and pathway analysis (bottom). (D) Quantitative real-time polymerase chain reaction assays were performed following 5′Aza and HGF treatment of HL-7702 (left) and HepG2 (right) cells. The relative levels of mRNA between treated cells vs. untreated cells were normalized to beta-actin. Values are expressed as the mean ± standard error. HGF, hepatocyte growth factor; 5′Aza, 5′Aza-2′-deoxycytidine.

