Figure 1.

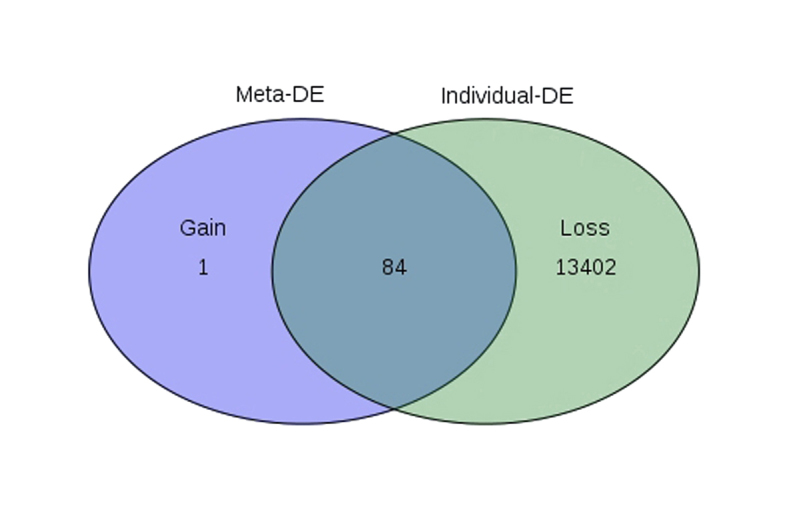
Venn diagram showing the overlap between DE genes identified from the meta-analysis (Meta-DE) and those combined from the individual data analyses (individual-DE). DE, differentially expressed.

Venn diagram showing the overlap between DE genes identified from the meta-analysis (Meta-DE) and those combined from the individual data analyses (individual-DE). DE, differentially expressed.