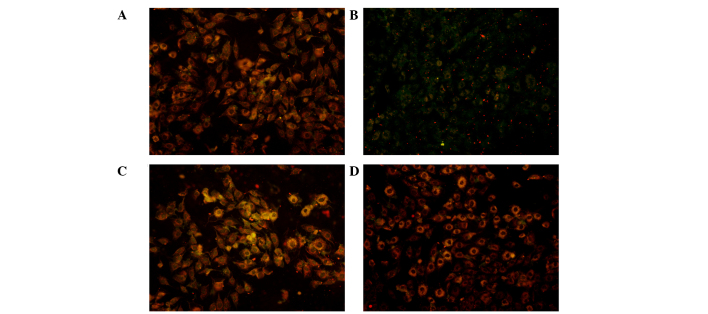
Figure 6.
Effects of SAN on mitochondrial membrane potential loss induced by Ang II. The density of JC-1 staining was assessed by fluorescence microscopy (magnification, x200). (A) Control; (B) Ang II (10 µM); (C) Ang II (10 µM) + SAN 0.5 µM; (D) Ang II (10 µM) + N-acetylcysteine (1 mM). Ang, angiotensin; SAN, sanguinarine.

